
After a lot of work on our Sequence Bundles visualisation method, we’re very excited to launch the Sequence Bundles web-app. The web application has been designed and developed by Science Practice, built by Joe Lau and is hosted by the European Bioinformatics Institute at the Wellcome Trust Genome Campus in Hinxton, UK. The application is part of our Sequence Bundles project, which also includes a gallery of Sequence Bundles visualisations.
Now that we have reached this milestone, we though it would be interesting to review the process of designing and developing Sequence Bundles, so here is a short story of how the project unfolded.
Designing new visualisations
Our Sequence Bundles project began in May 2013 when we entered the BioVis2013 redesign competition. The challenge was to come up with a new way of visualising multiple sequence alignments (MSAs) that would improve upon the long-standing sequence logo visualisation. The competition brief was well aligned with our own interests, so we decided to give it a go and prepare a submission.
First sketch-notes from our initial research into bioinformatics and sequence logos.
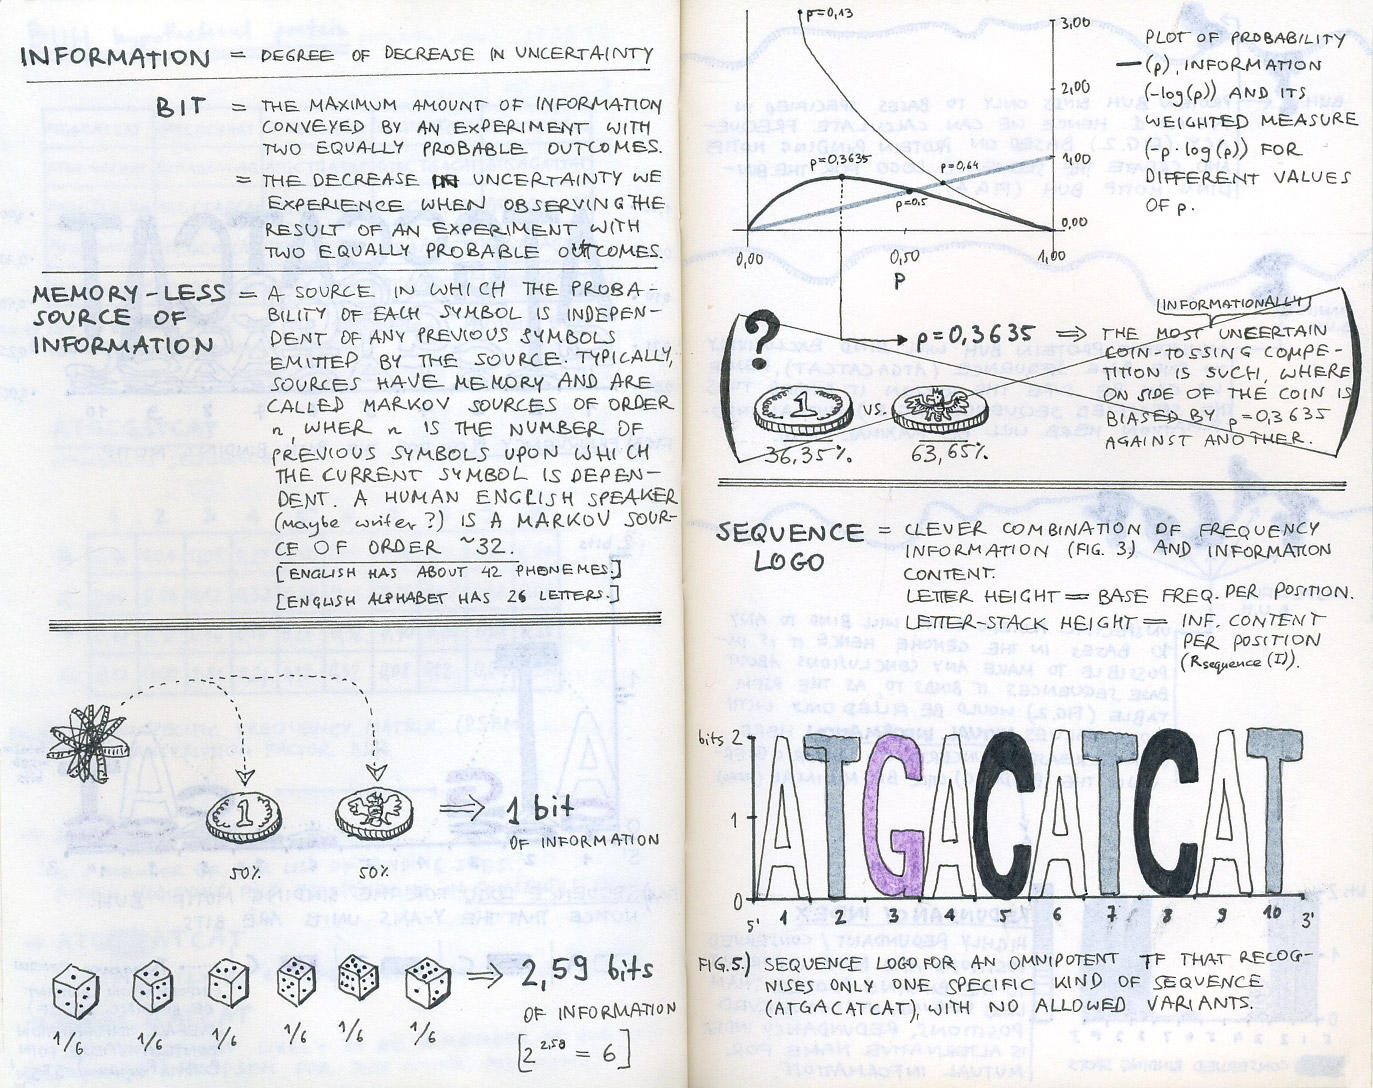
We started by learning about bioinformatics and finding out what it is that bioinformaticians are trying to find in their genomic or proteomic data when visualising MSAs. Initial desk research helped us cover the basics (reading Ivan Erill’s well written entry-level article was very helpful in understanding how information content is represented in sequence logos), but it was not until we went out to talk to bioinformatics researchers that we got a good understanding of the challenges they face.
In summer 2013 we met with Nick Goldman and Roland Schwarz who work together at the Goldman group at the European Bioinformatics Institute (EBI). They helped us understand the questions they would be asking when visualising MSAs. We learned about residue correlations and sequence motifs. We then started sketching intensively to explore the ways in which this information can be distilled from an MSA and represented in a new visualisation.
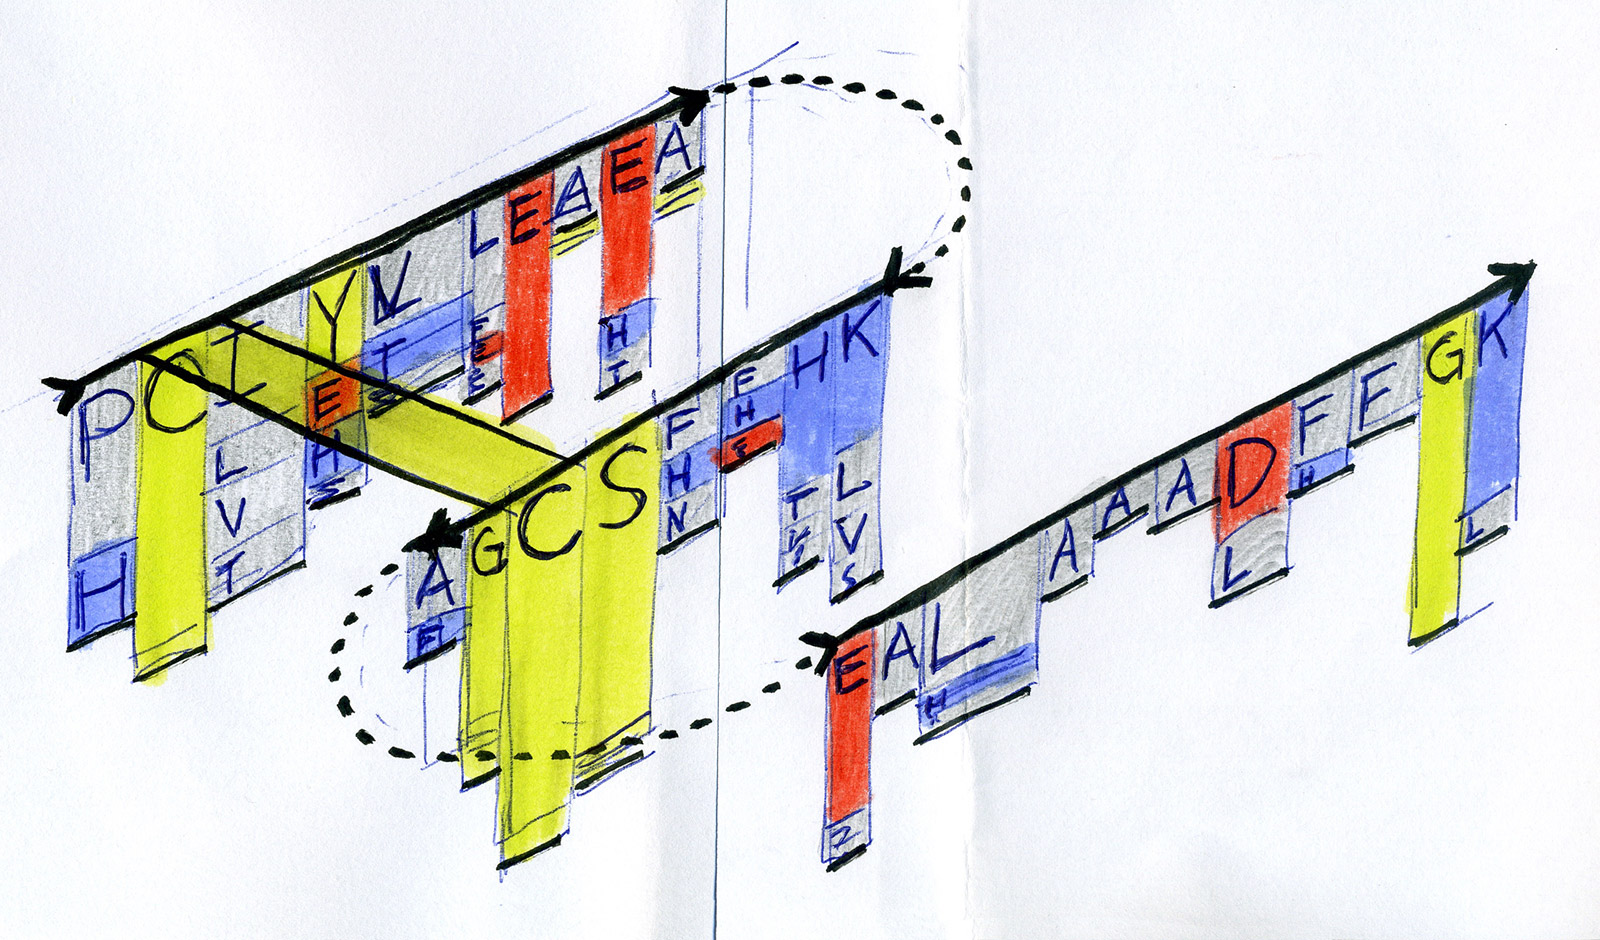
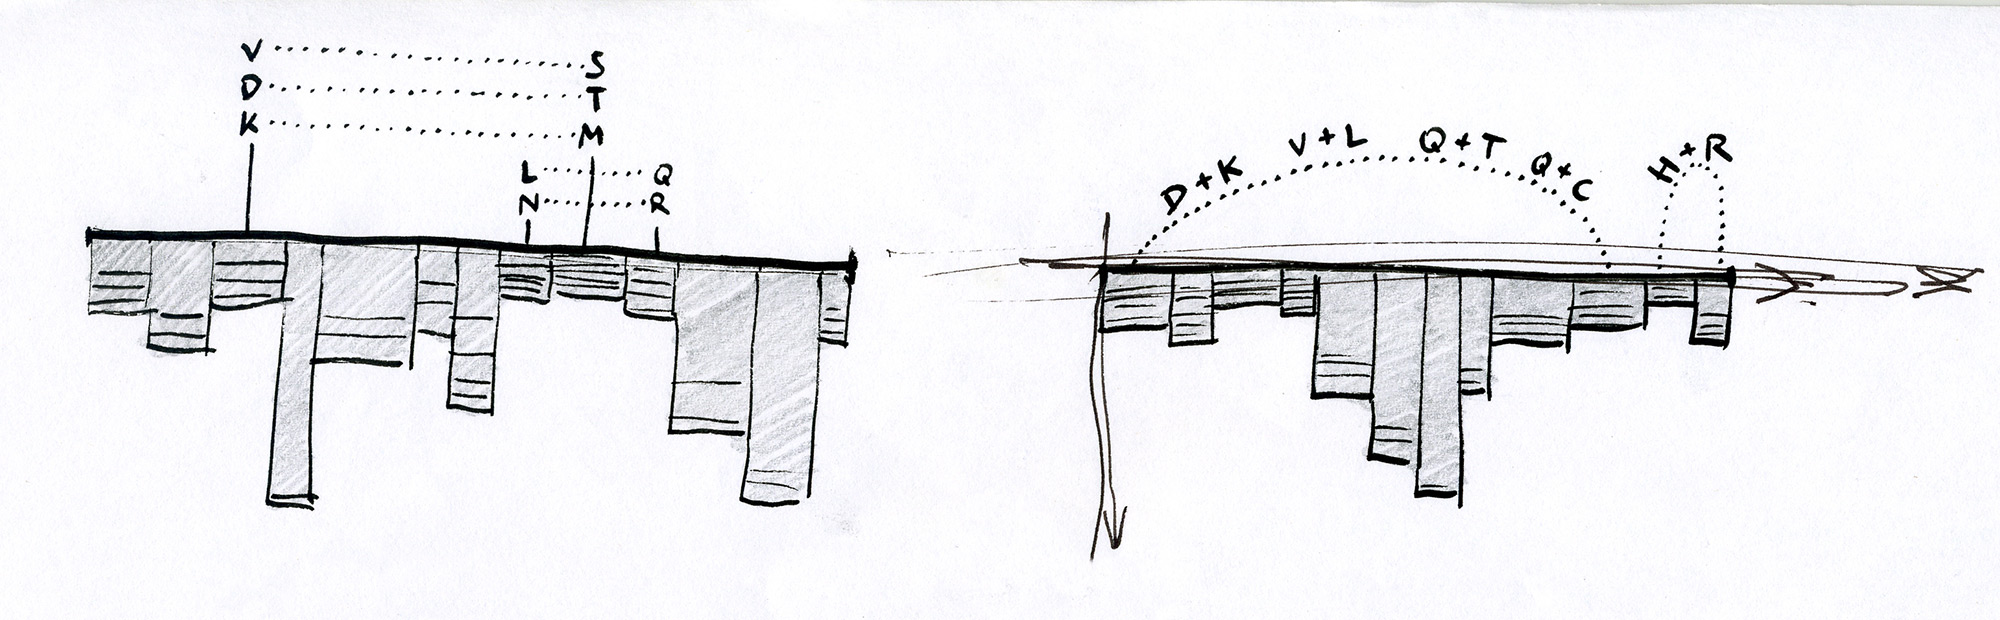
Early sketches — exploring ways to visualise sequence motifs and correlations.
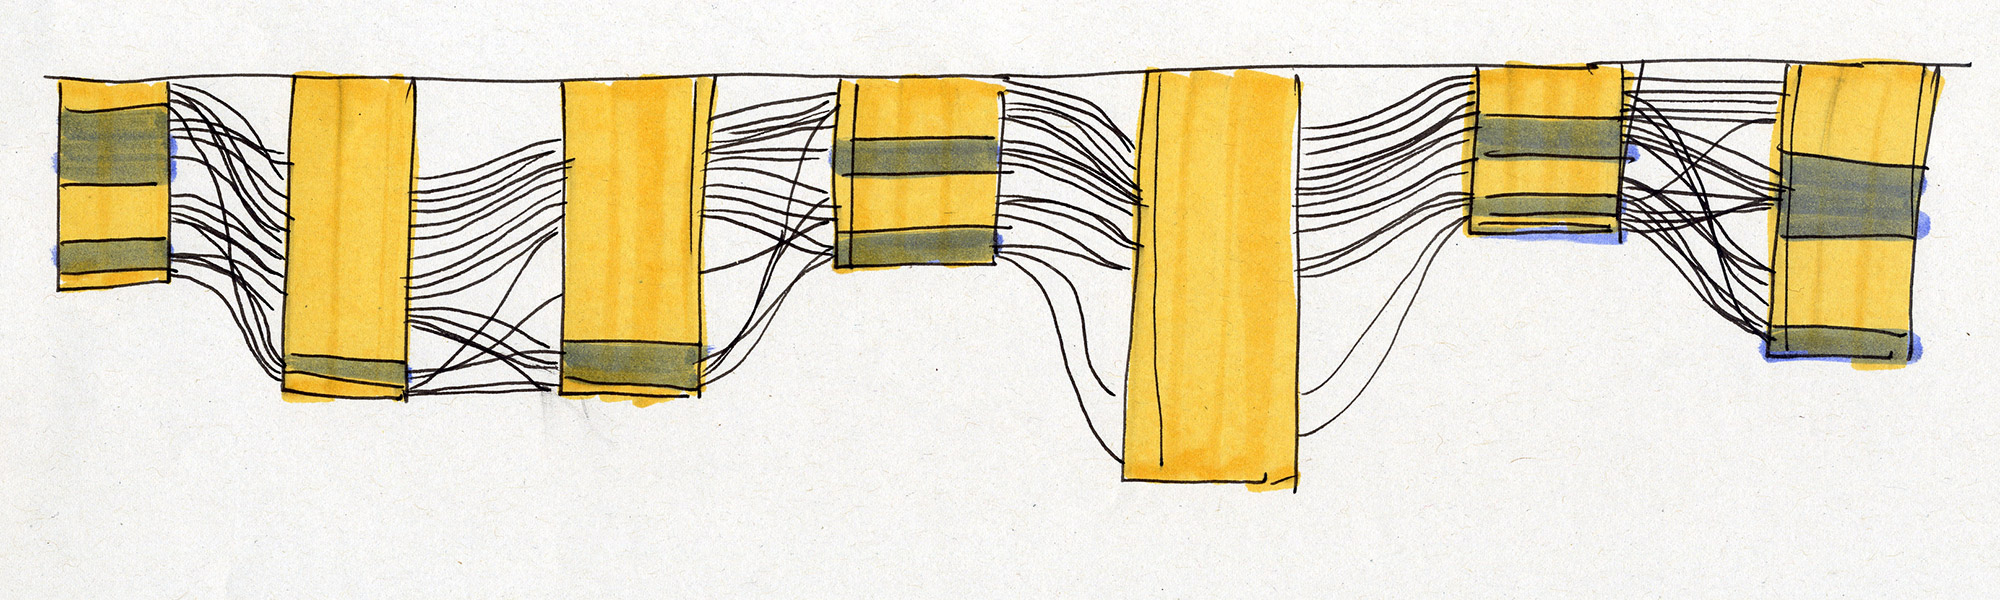
Early Sequence Bundles sketches.
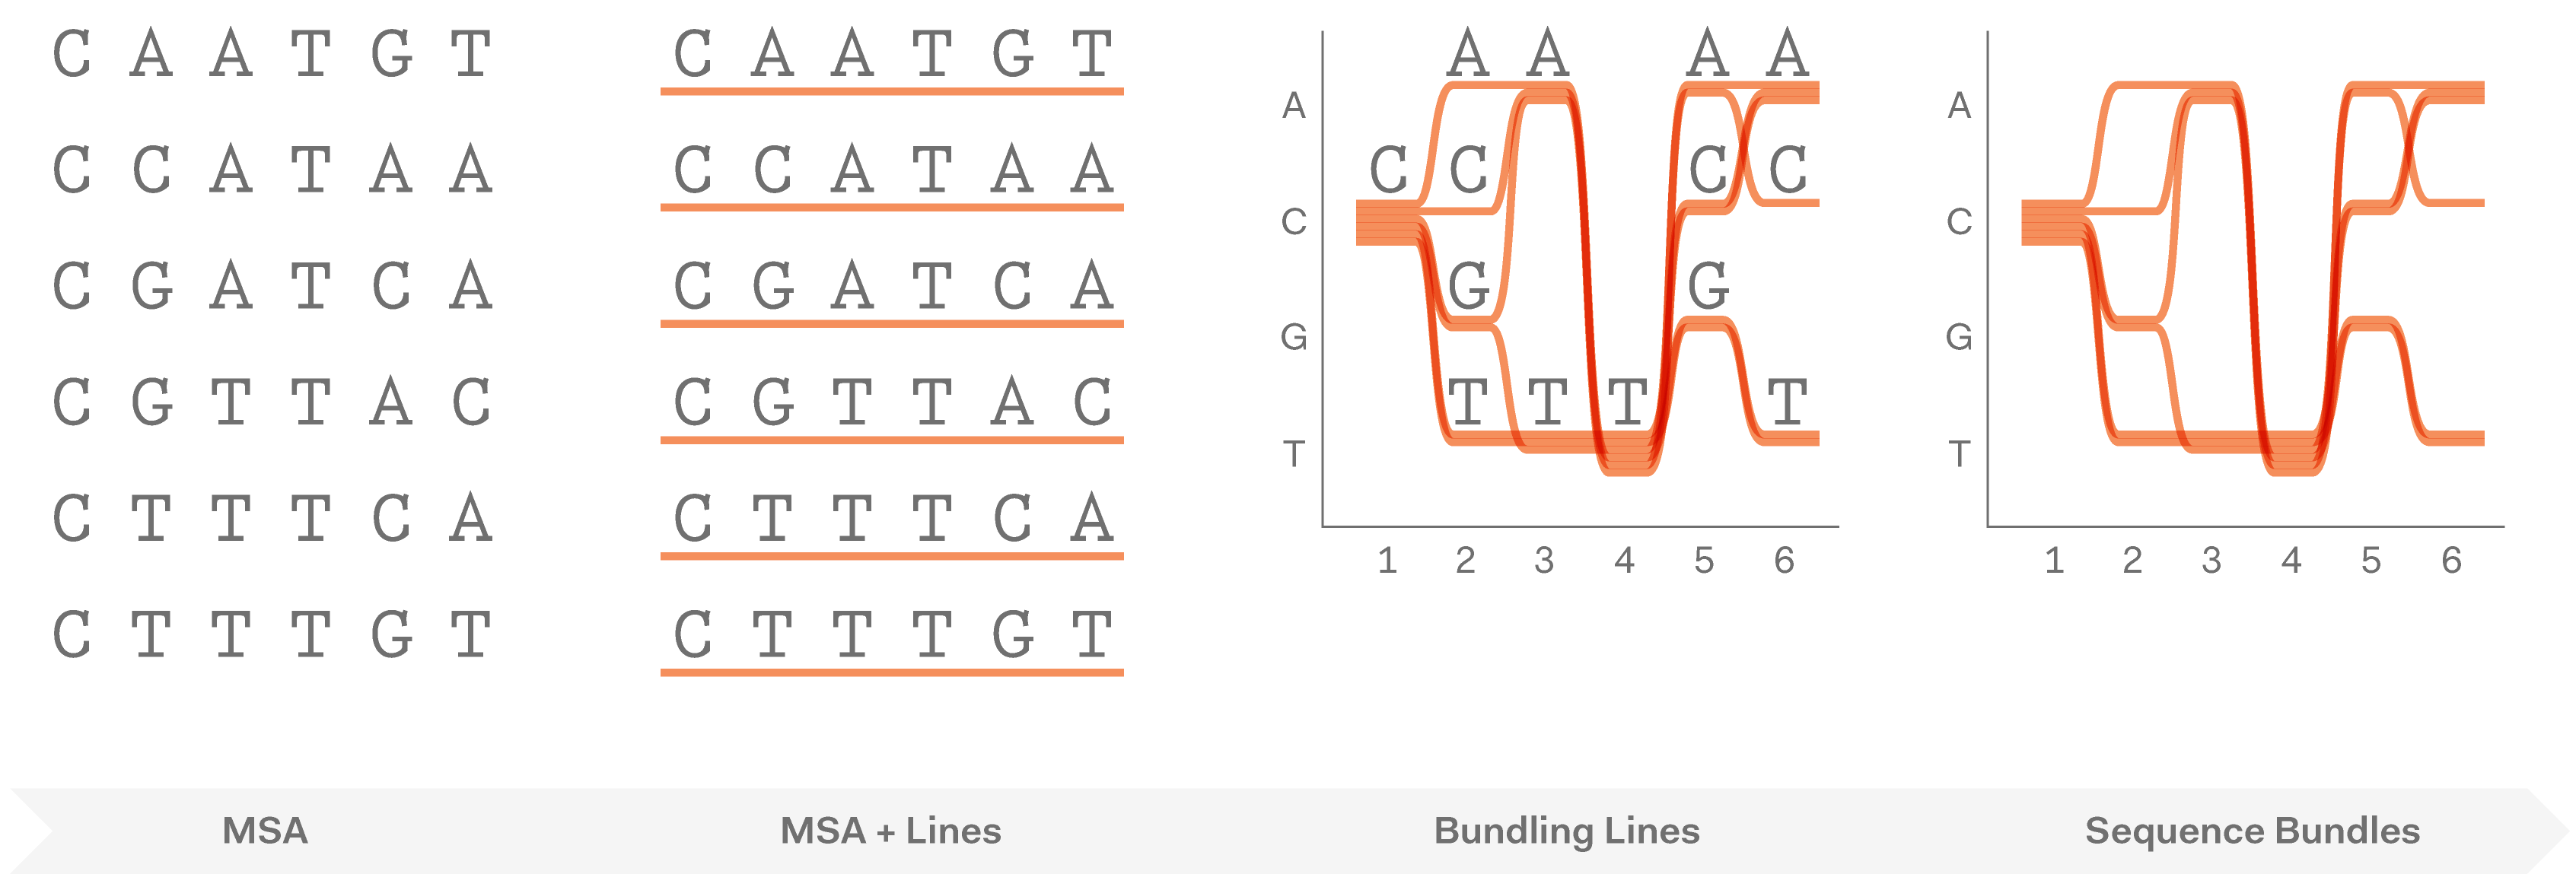
After exploring various approaches and testing how they work in hand-drawn sketches, we found that representing individual sequences as continuous lines can be promising. Combining a number of such lines in a single image would make an easy-to-interpret overview of all sequences in the MSA. Most importantly, this approach allowed us to retain all information about sequence content in each position in the MSA, and thus to provide a salient display of hidden sequence patterns. This is how it works in principle:
At this point we named the project Sequence Bundles, which has proven to be a descriptive and clear name.
Moving on from sketching by hand to generating visualisations in code allowed us to scale up and find out whether Sequence Bundles would work with real-life bioinformatics data. In the end, most bioinformatics research involves many more sequences than one can comfortably draw by hand. We built our first proof-of-concept Sequence Bundles generator in Processing and used it to explore the method further.
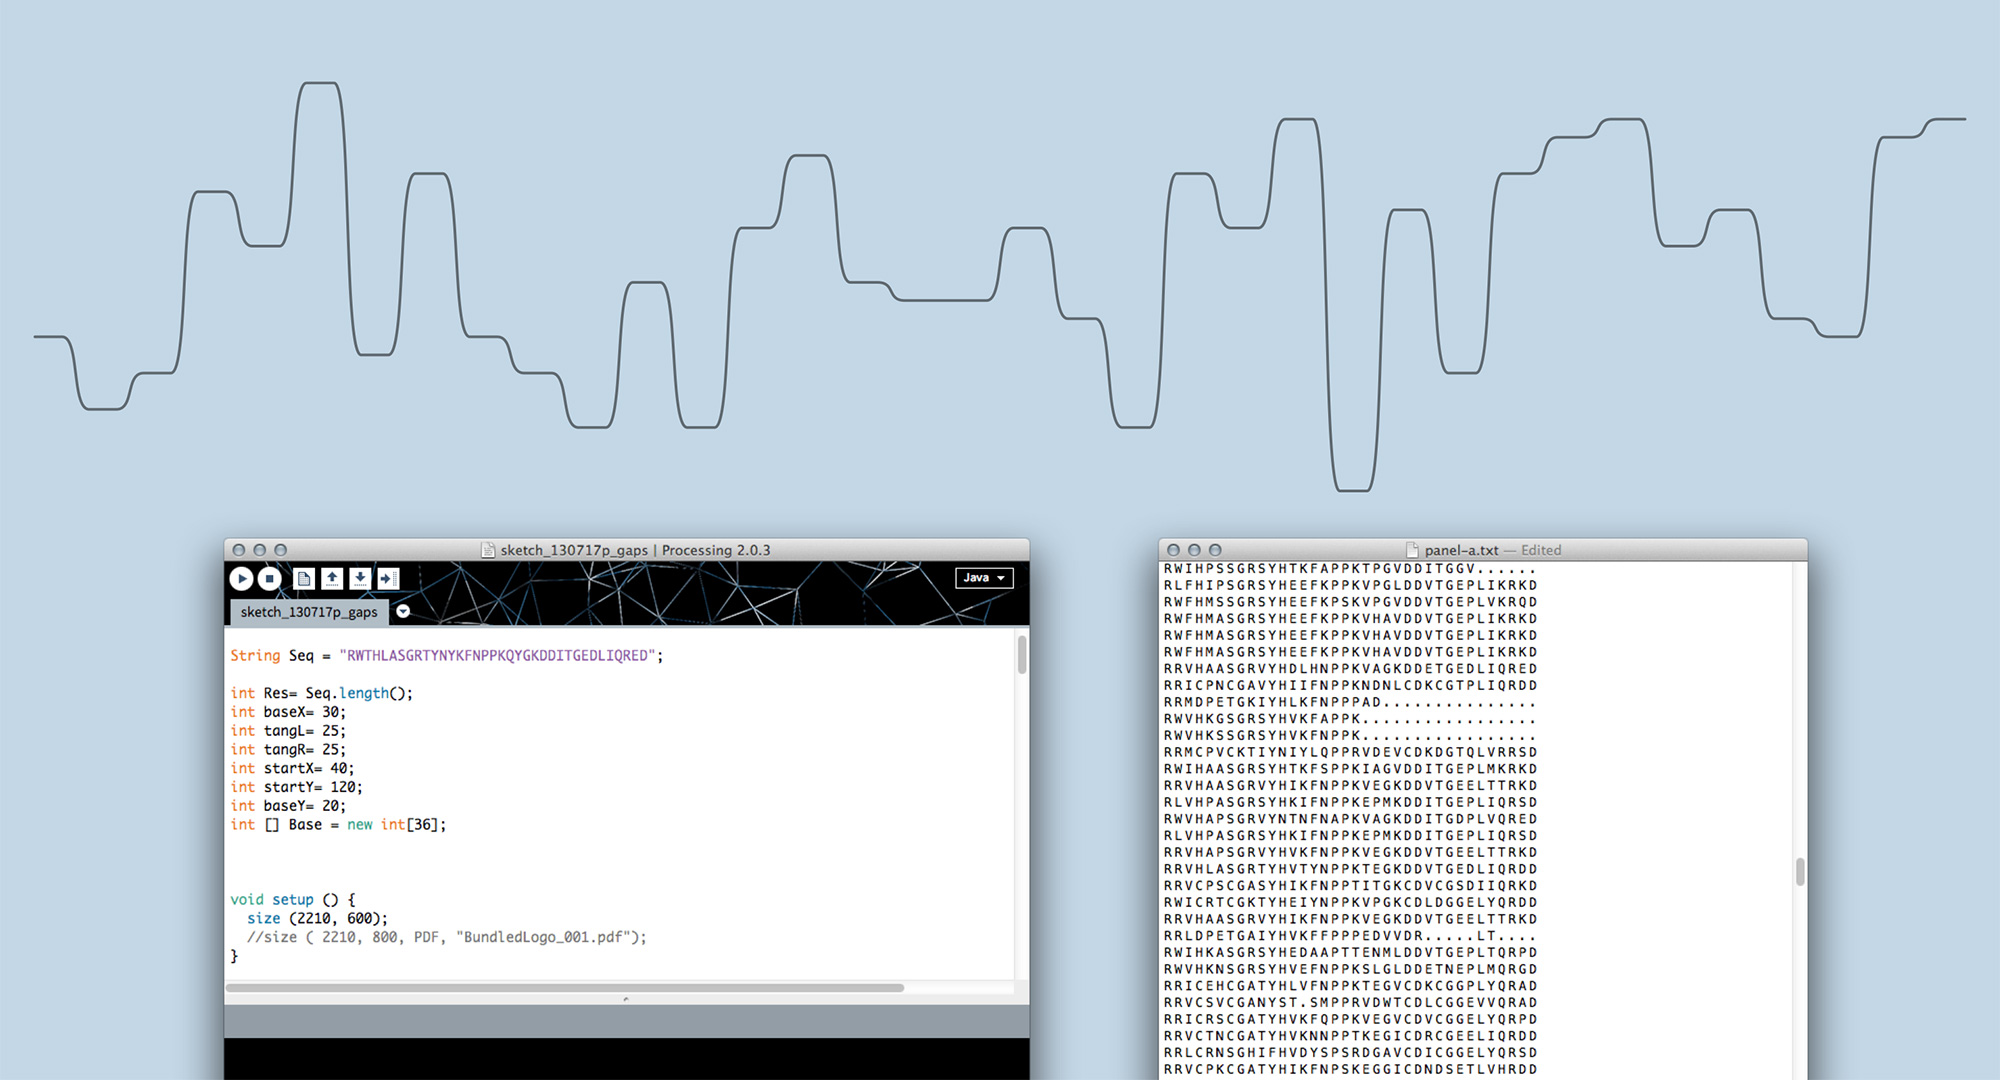
Sequence Bundles proof-of-concept prototype built in Processing.
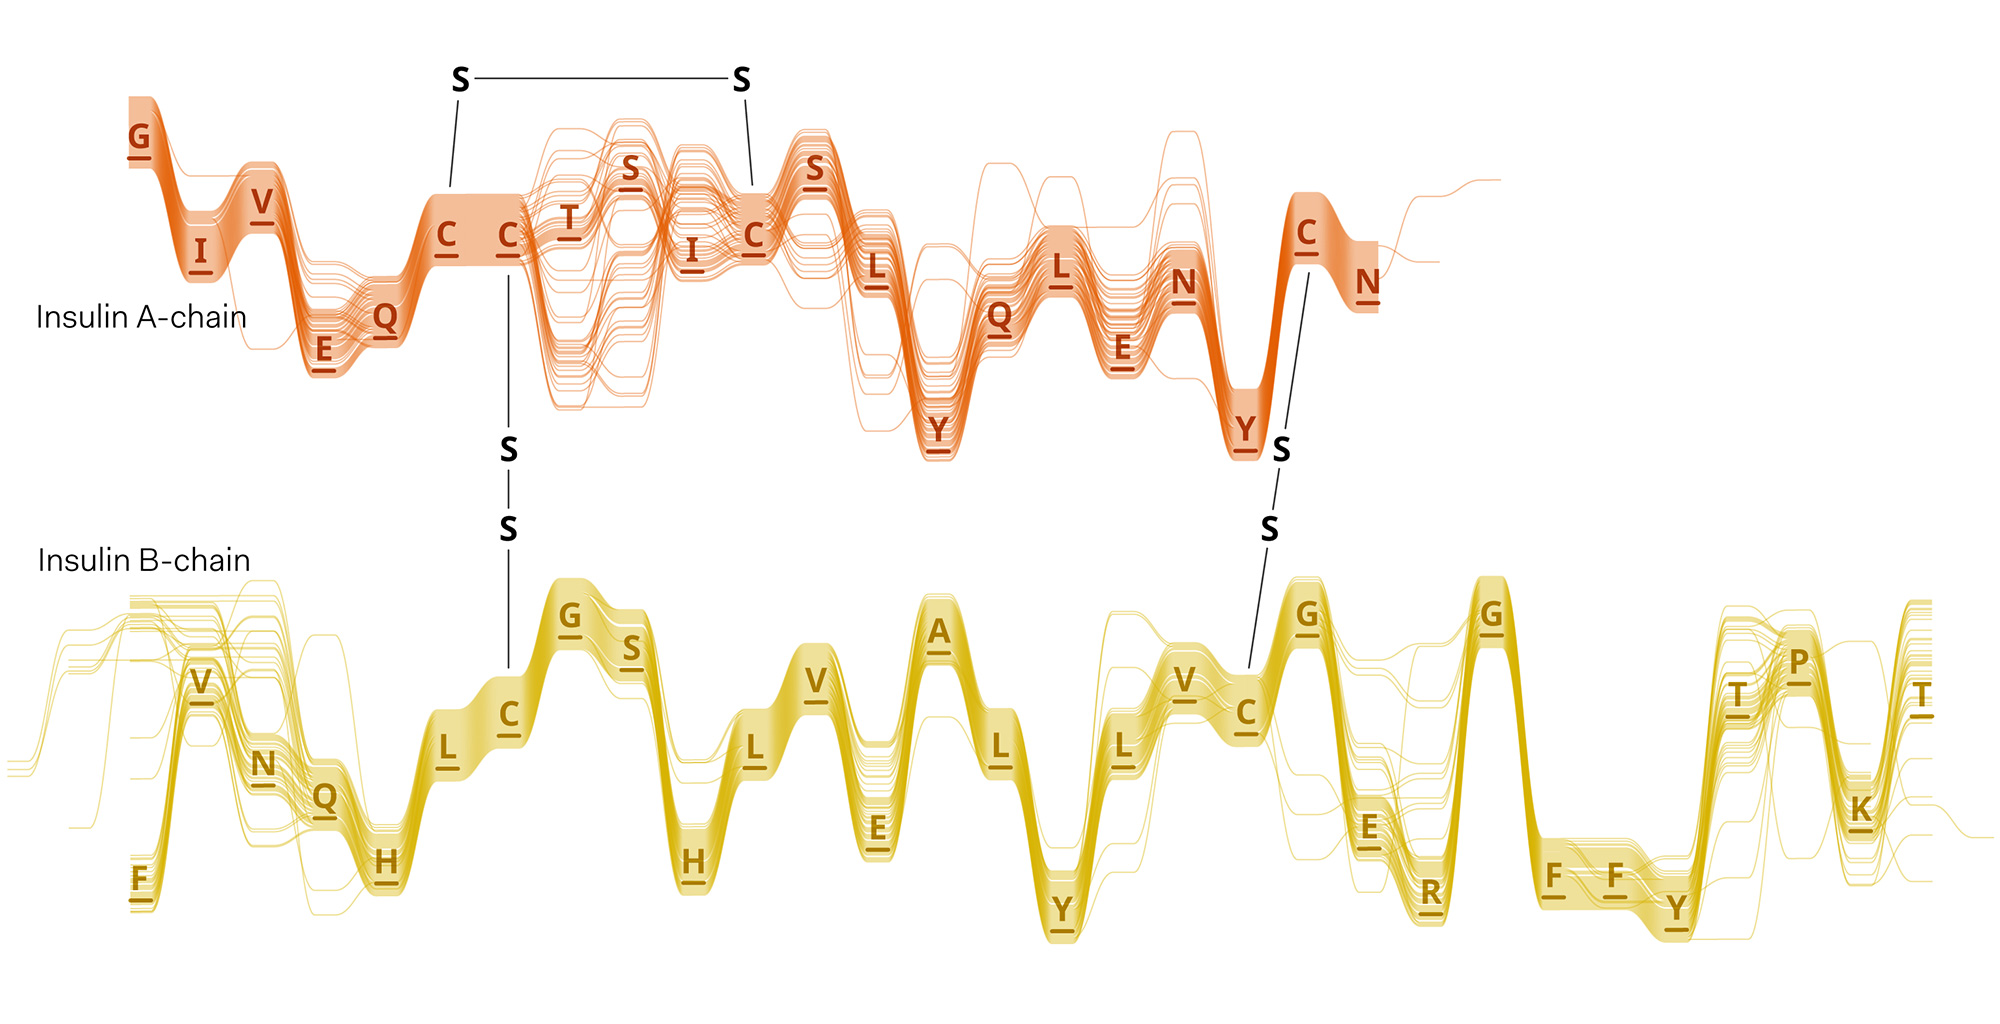
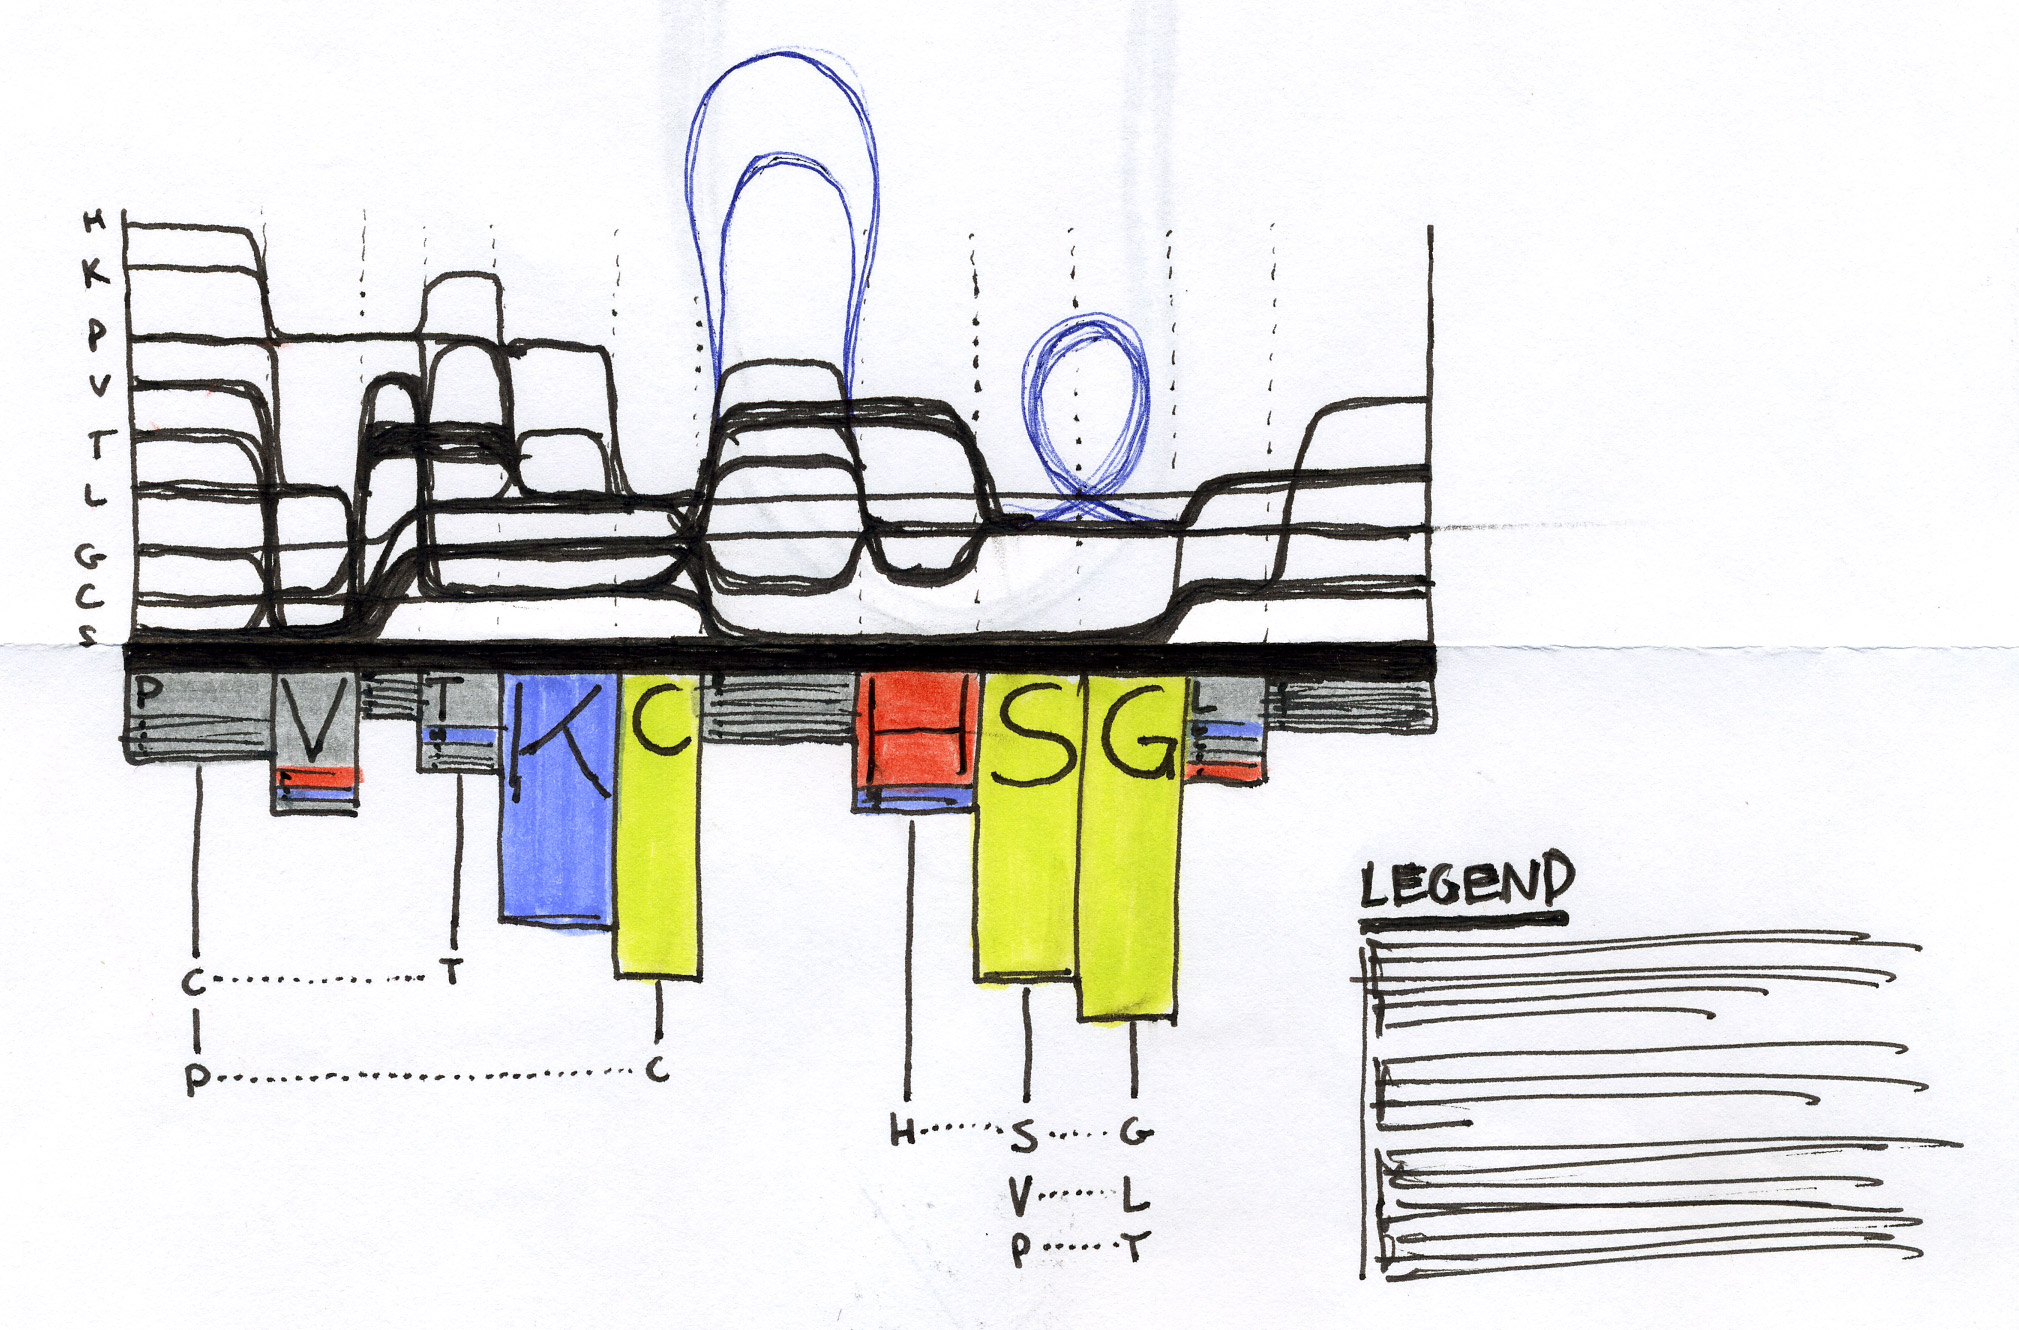
Experiments in various data layouts and sequence representations (using insulin MSAs as sample datasets).
Discovering hidden motifs
We used the BioVis2013 competition ADK_Lid data as input to generate Sequence Bundles images with our proof-of-concept tool. For the design of our visualisation method, we were interested in exploring various visualisation layouts, curvatures of the bezier line, different line colouring and grouping schemes, best ways to represent gaps in MSAs, as well as meaningful arrangements of amino acid residues stored on the Y-axis. Even though our design exploration was aimed at producing engaging Sequence Bundles visualisations, by playing with the display of the data we began to observe a number of interesting features in the MSA that previously remained hidden. As we later learned, these features were also a surprise to the authors of that dataset.
We summarised our findings in our submission paper for the BioVis2013 contest, and later in an article in BMC Proceedings, published in the journal’s special issue reporting on the results of the BioVis2013 redesign competition.
Later in 2013 we presented our Sequence Bundles visualisation method at the IEEEVis2013 conference in Atlanta, GA — one of the most prestigious global visualisation conferences — and won an award at the BioVis2013 redesign competition.
Design experiments that helped us discover hidden sequence features in the ADK_Lid BioVis2013 dataset.
Building tools for discovery
Encouraged by the results of the BioVis2013 competition, we decided to pursue the development of Sequence Bundles further.
In 2014 we won Innovate UK funding to support the next stage of our Sequence Bundles project. Following the discussion presented in our BMC Proceedings paper, our goal was to develop a web-based interactive visual analytics tool for bioinformatics that would employ Sequence Bundles as its main data visualisation method. We teamed up with the Goldman group from the EBI once again to work on this project.
Between August and December 2014 we worked intensively on building a rendering engine that would generate customisable Sequence Bundles visualisations. In parallel to that we also tested Sequence Bundles with bioinformatics researchers and experts around the world in our user research programme. This allowed us to start ongoing conversations with several scientific groups in both academia and industry that do great work in diverse areas, from healthcare to agri-tech. Recently, we also exhibited Sequence Bundles publicly at ‘The Art of Networks II’ show, at the famous New York Hall of Science in NY.
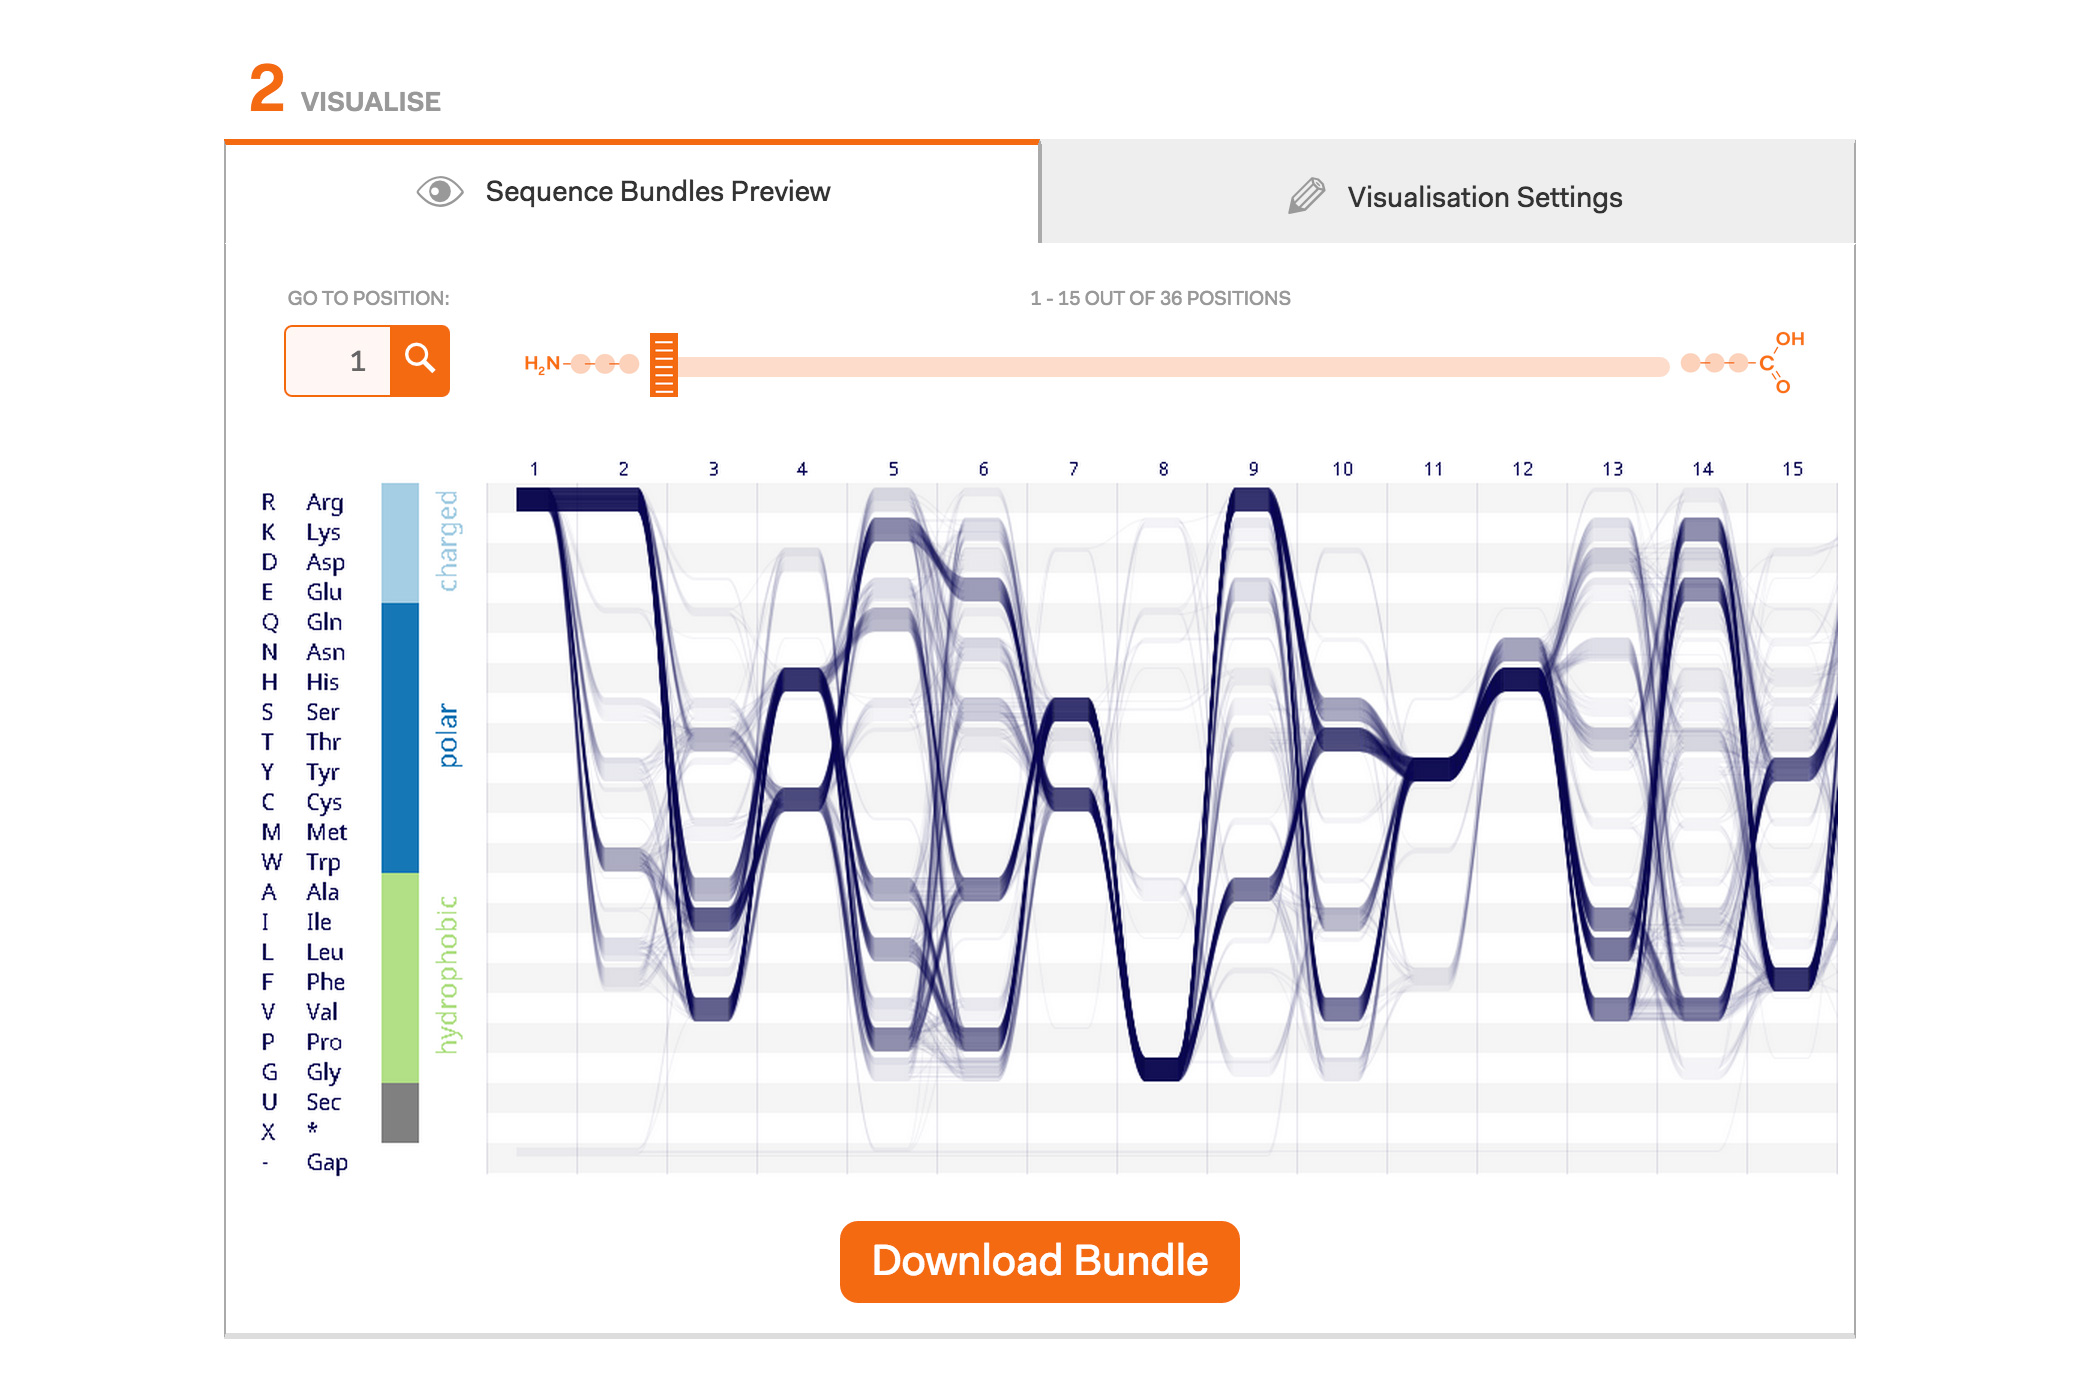
Our project concludes with the publishing of this Sequence Bundles web visualisation tool. It is available to everyone who wants to use Sequence Bundles to visualise their MSAs that contain up to 1000 sequences and are no longer than 1000 positions per sequence. The web tool is dedicated for the visualisation of protein data sets; however, in principle, Sequence Bundles can be applied to genomic or — in fact — any other sequential data types. Our web tool allows the user to import their FASTA-formatted data or to explore eight different example datasets. The visualisation is customisable, enabling the user to select various layouts, colour, data density and gap rendering options. Sequence Bundles images can be downloaded as PNG graphics and used in publications. We are also curating a gallery of interesting Sequence Bundles examples, so please get in touch if you want to share your visualisations with other Sequence Bundles users.
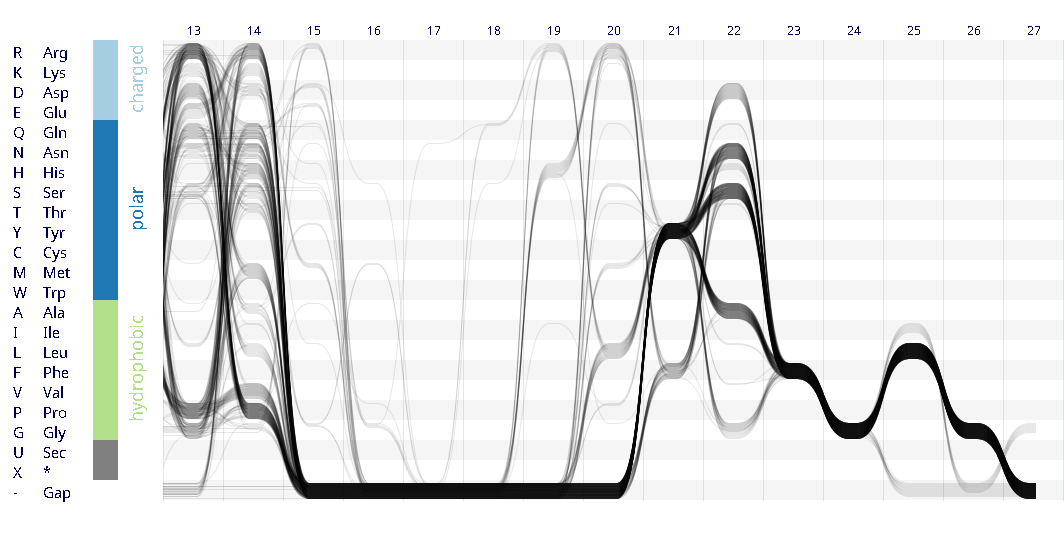
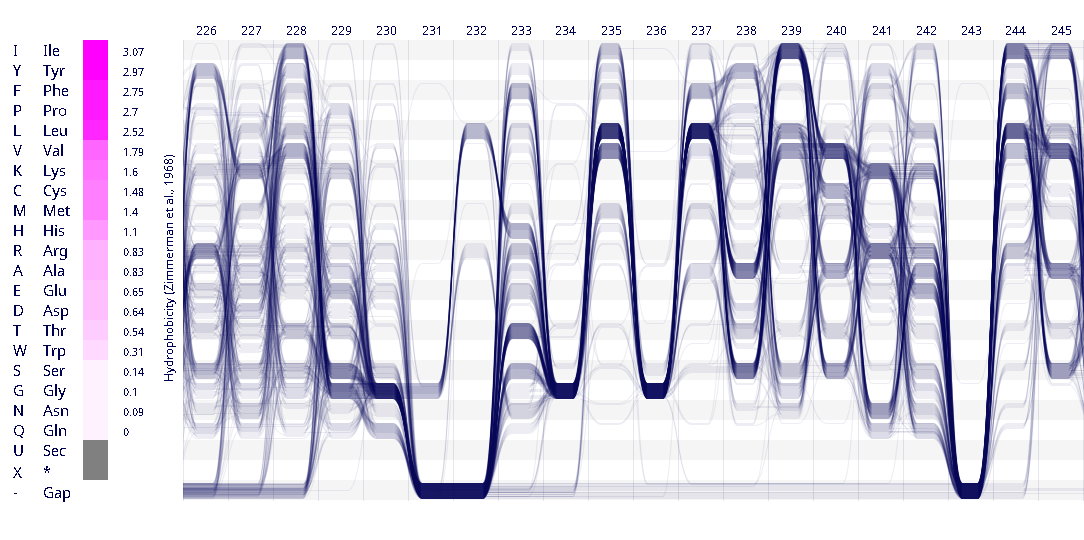
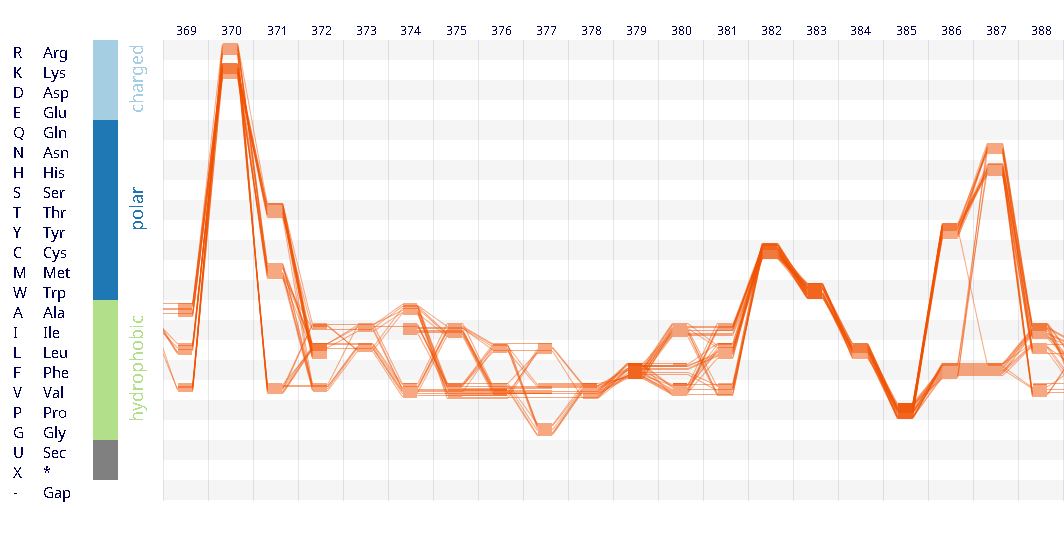
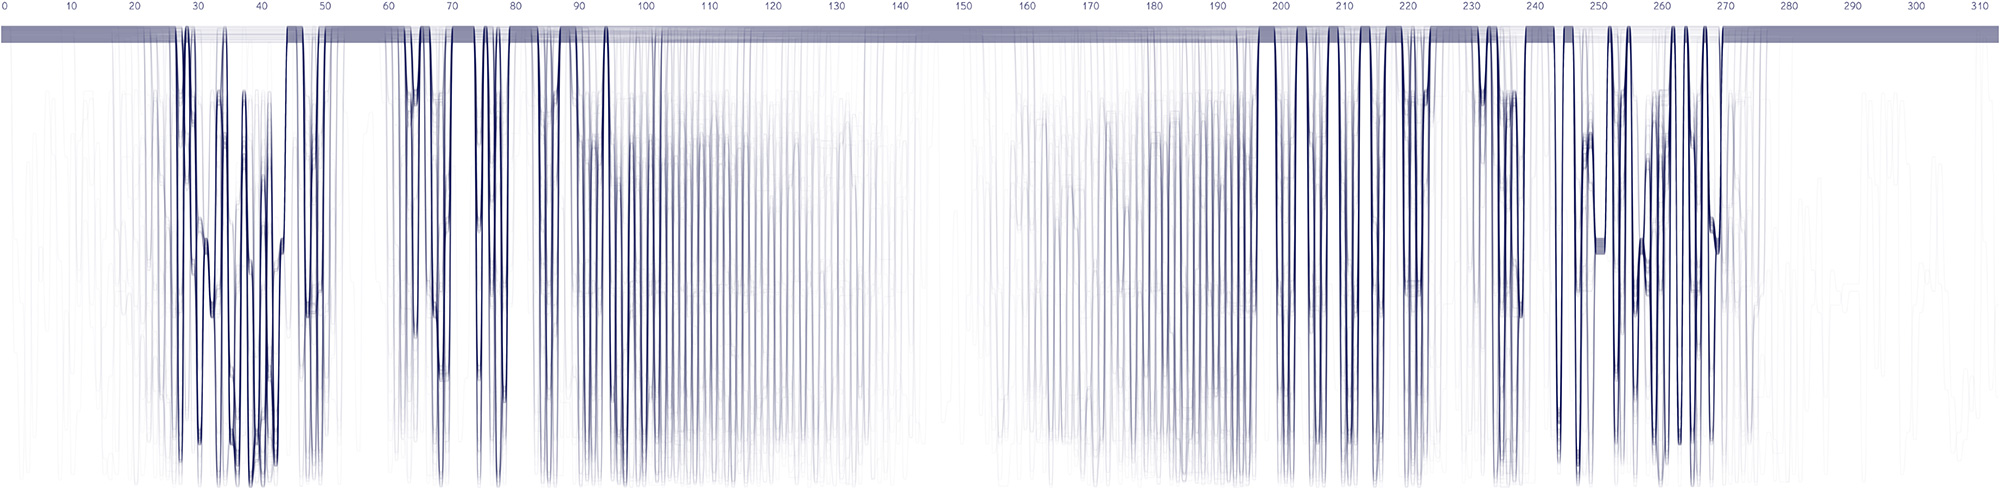
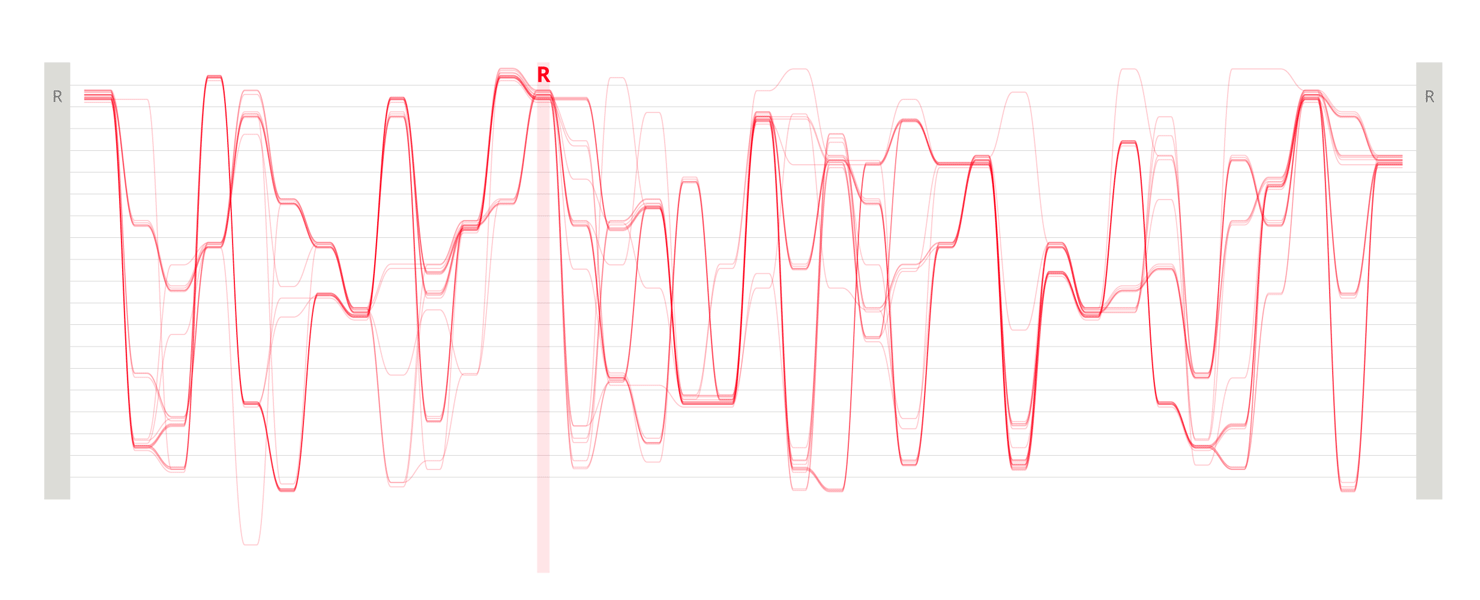
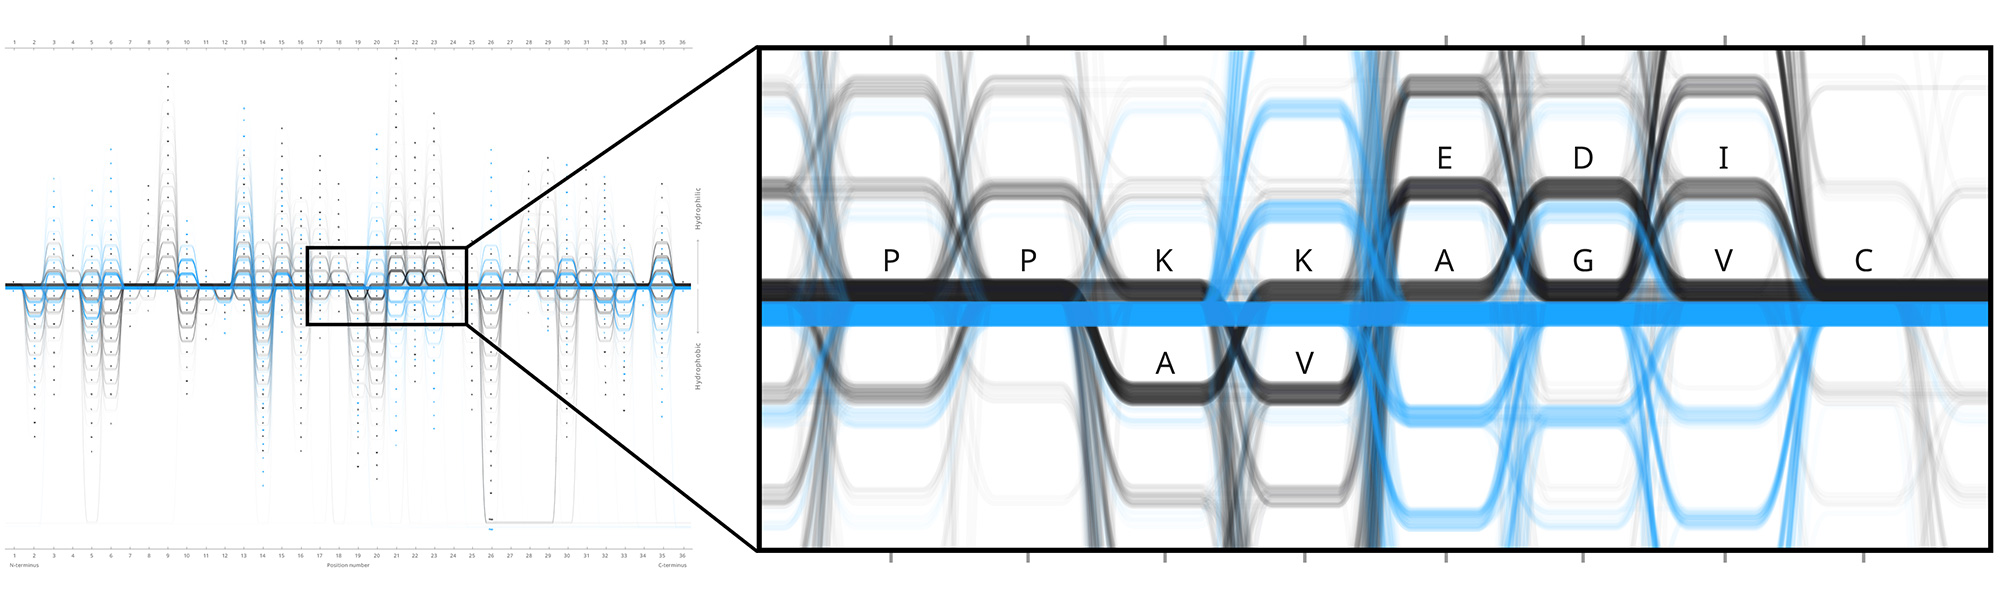
Example protein visualisations generated with the Sequence Bundles web application.
Sequence Bundles will soon be available as a desktop application, with additional features and visualisation capabilities exceeding the 1000 sequences × 1000 positions limitations of an web-app. We will make a separate announcement about this. If you wish to be notified once the desktop application is released, please let us know via email.
We are very interested in learning how Sequence Bundles are used by the scientific community. Please share with us your comments, ideas, and feedback. As always, we are open for collaborations, so don’t hesitate to get in touch if you think we can work on something together.