SNPshot
Distilling variant information for clinical genetics
The challenge: Help clinical geneticists to rapidly consume key information about variants.
Our solution: Typographic visualisation of variant information to support rapid decision making.
Genomics databases are vital resources for identifying the genetic causes of disease. However, because they are so rich with information, it can be a challenge to use them in decision-making for diagnostic genetics.
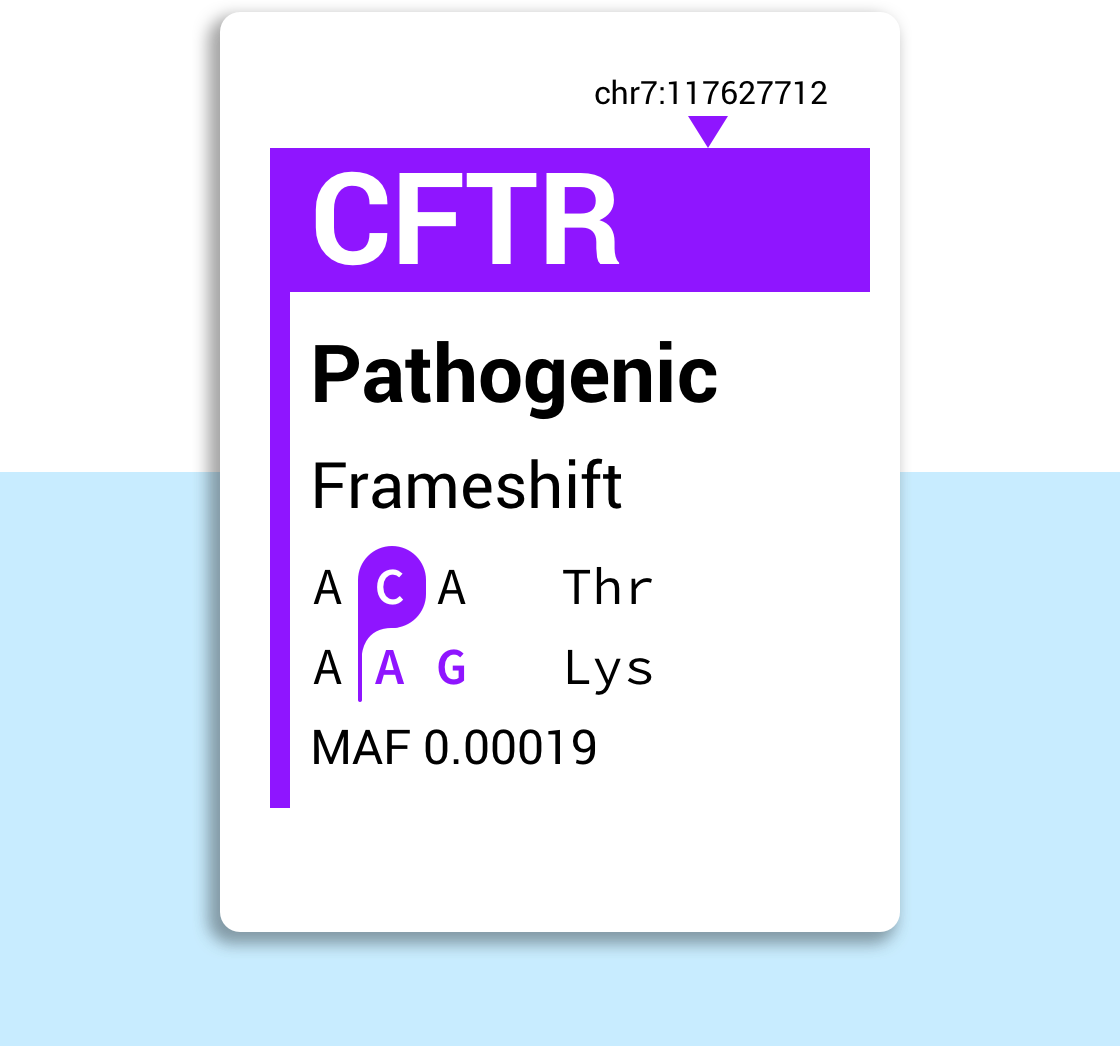
To help address this challenge we designed SNPshot— a novel way to distill and display the most important information about SNPs. SNPshot provides a visual summary of the key information that clinical geneticists need when investigating and comparing variants.
Helping geneticists know where to invest time
When clinical geneticists analyse patient sequence data, they will often work through a list of genetic variants that could be
Using these databases can be challenging. Users often need to navigate through huge amounts of information that lack hierarchy,
We set ourselves a challenge to present the most relevant information about SNPs to clinical users, helping them to quickly and easily make decisions on which variants need to be investigated in detail.
Introducing hierarchy to SNP information
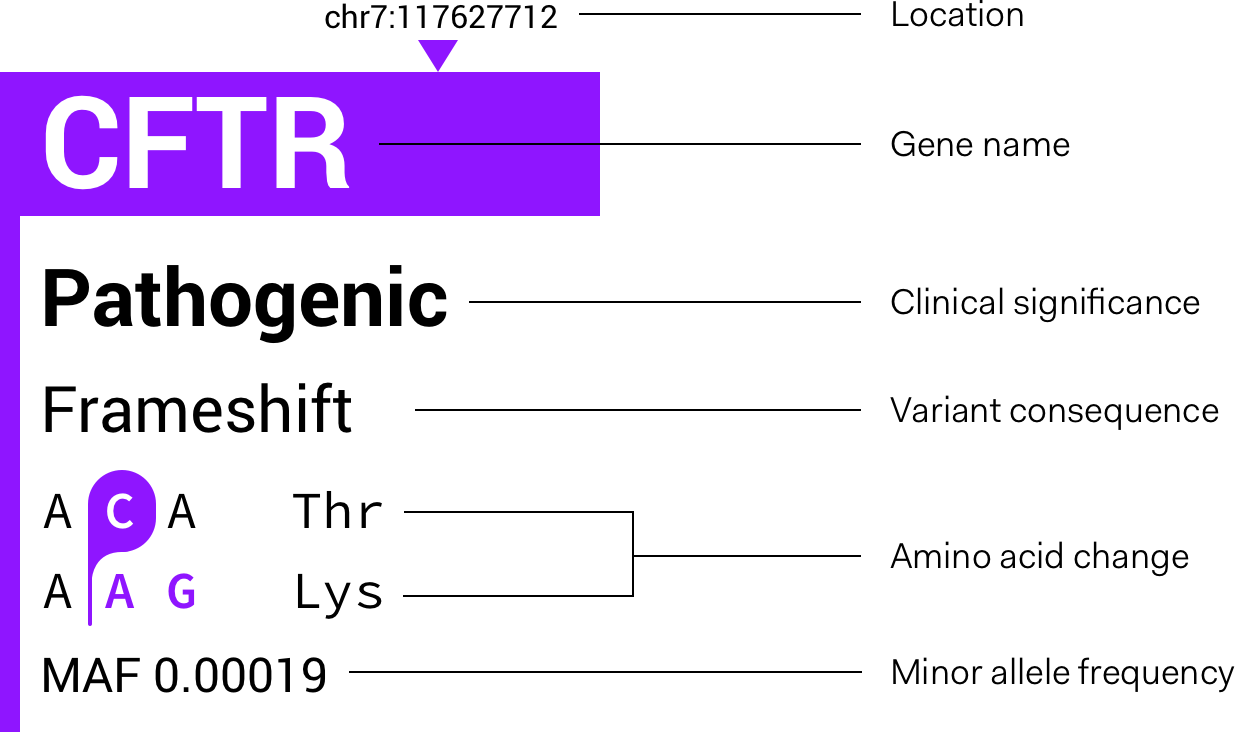
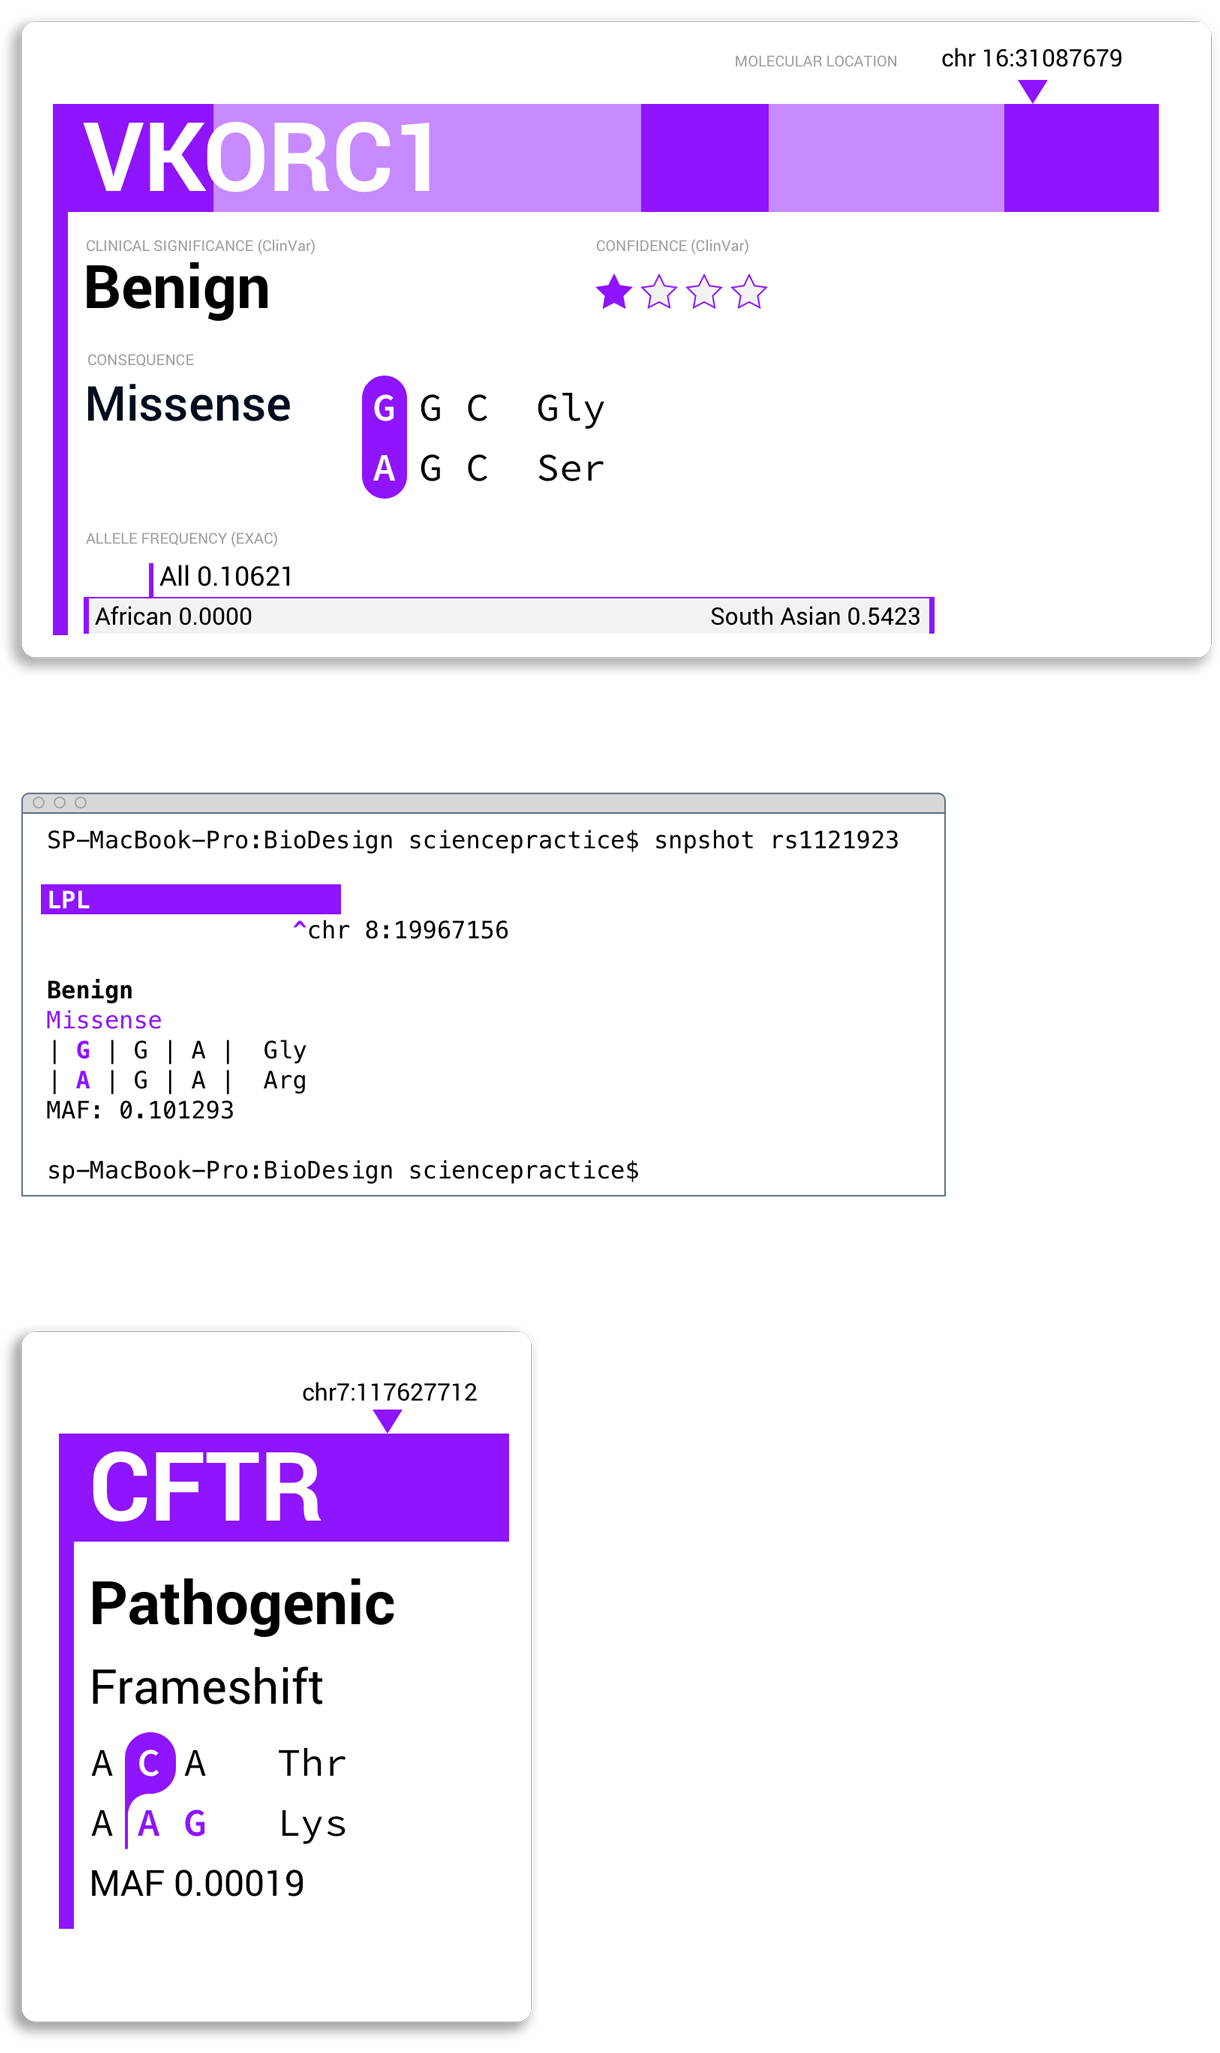
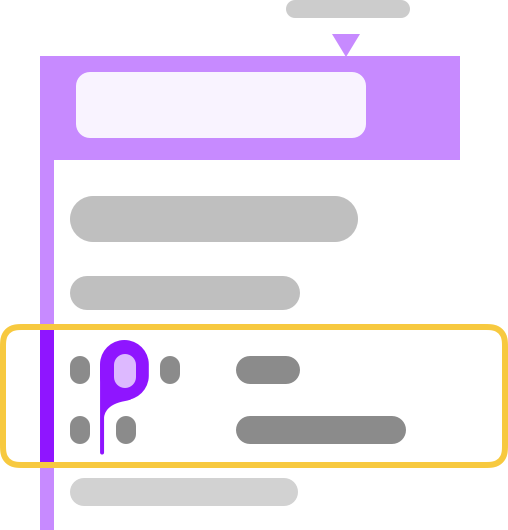
After 3 rounds of iteration and user research, we arrived at the design shown above. Key information types are prioritised using typography, size, colour, and positioning. Features such as chromosomal location and the nucleotide change are shown using simple visualisations.
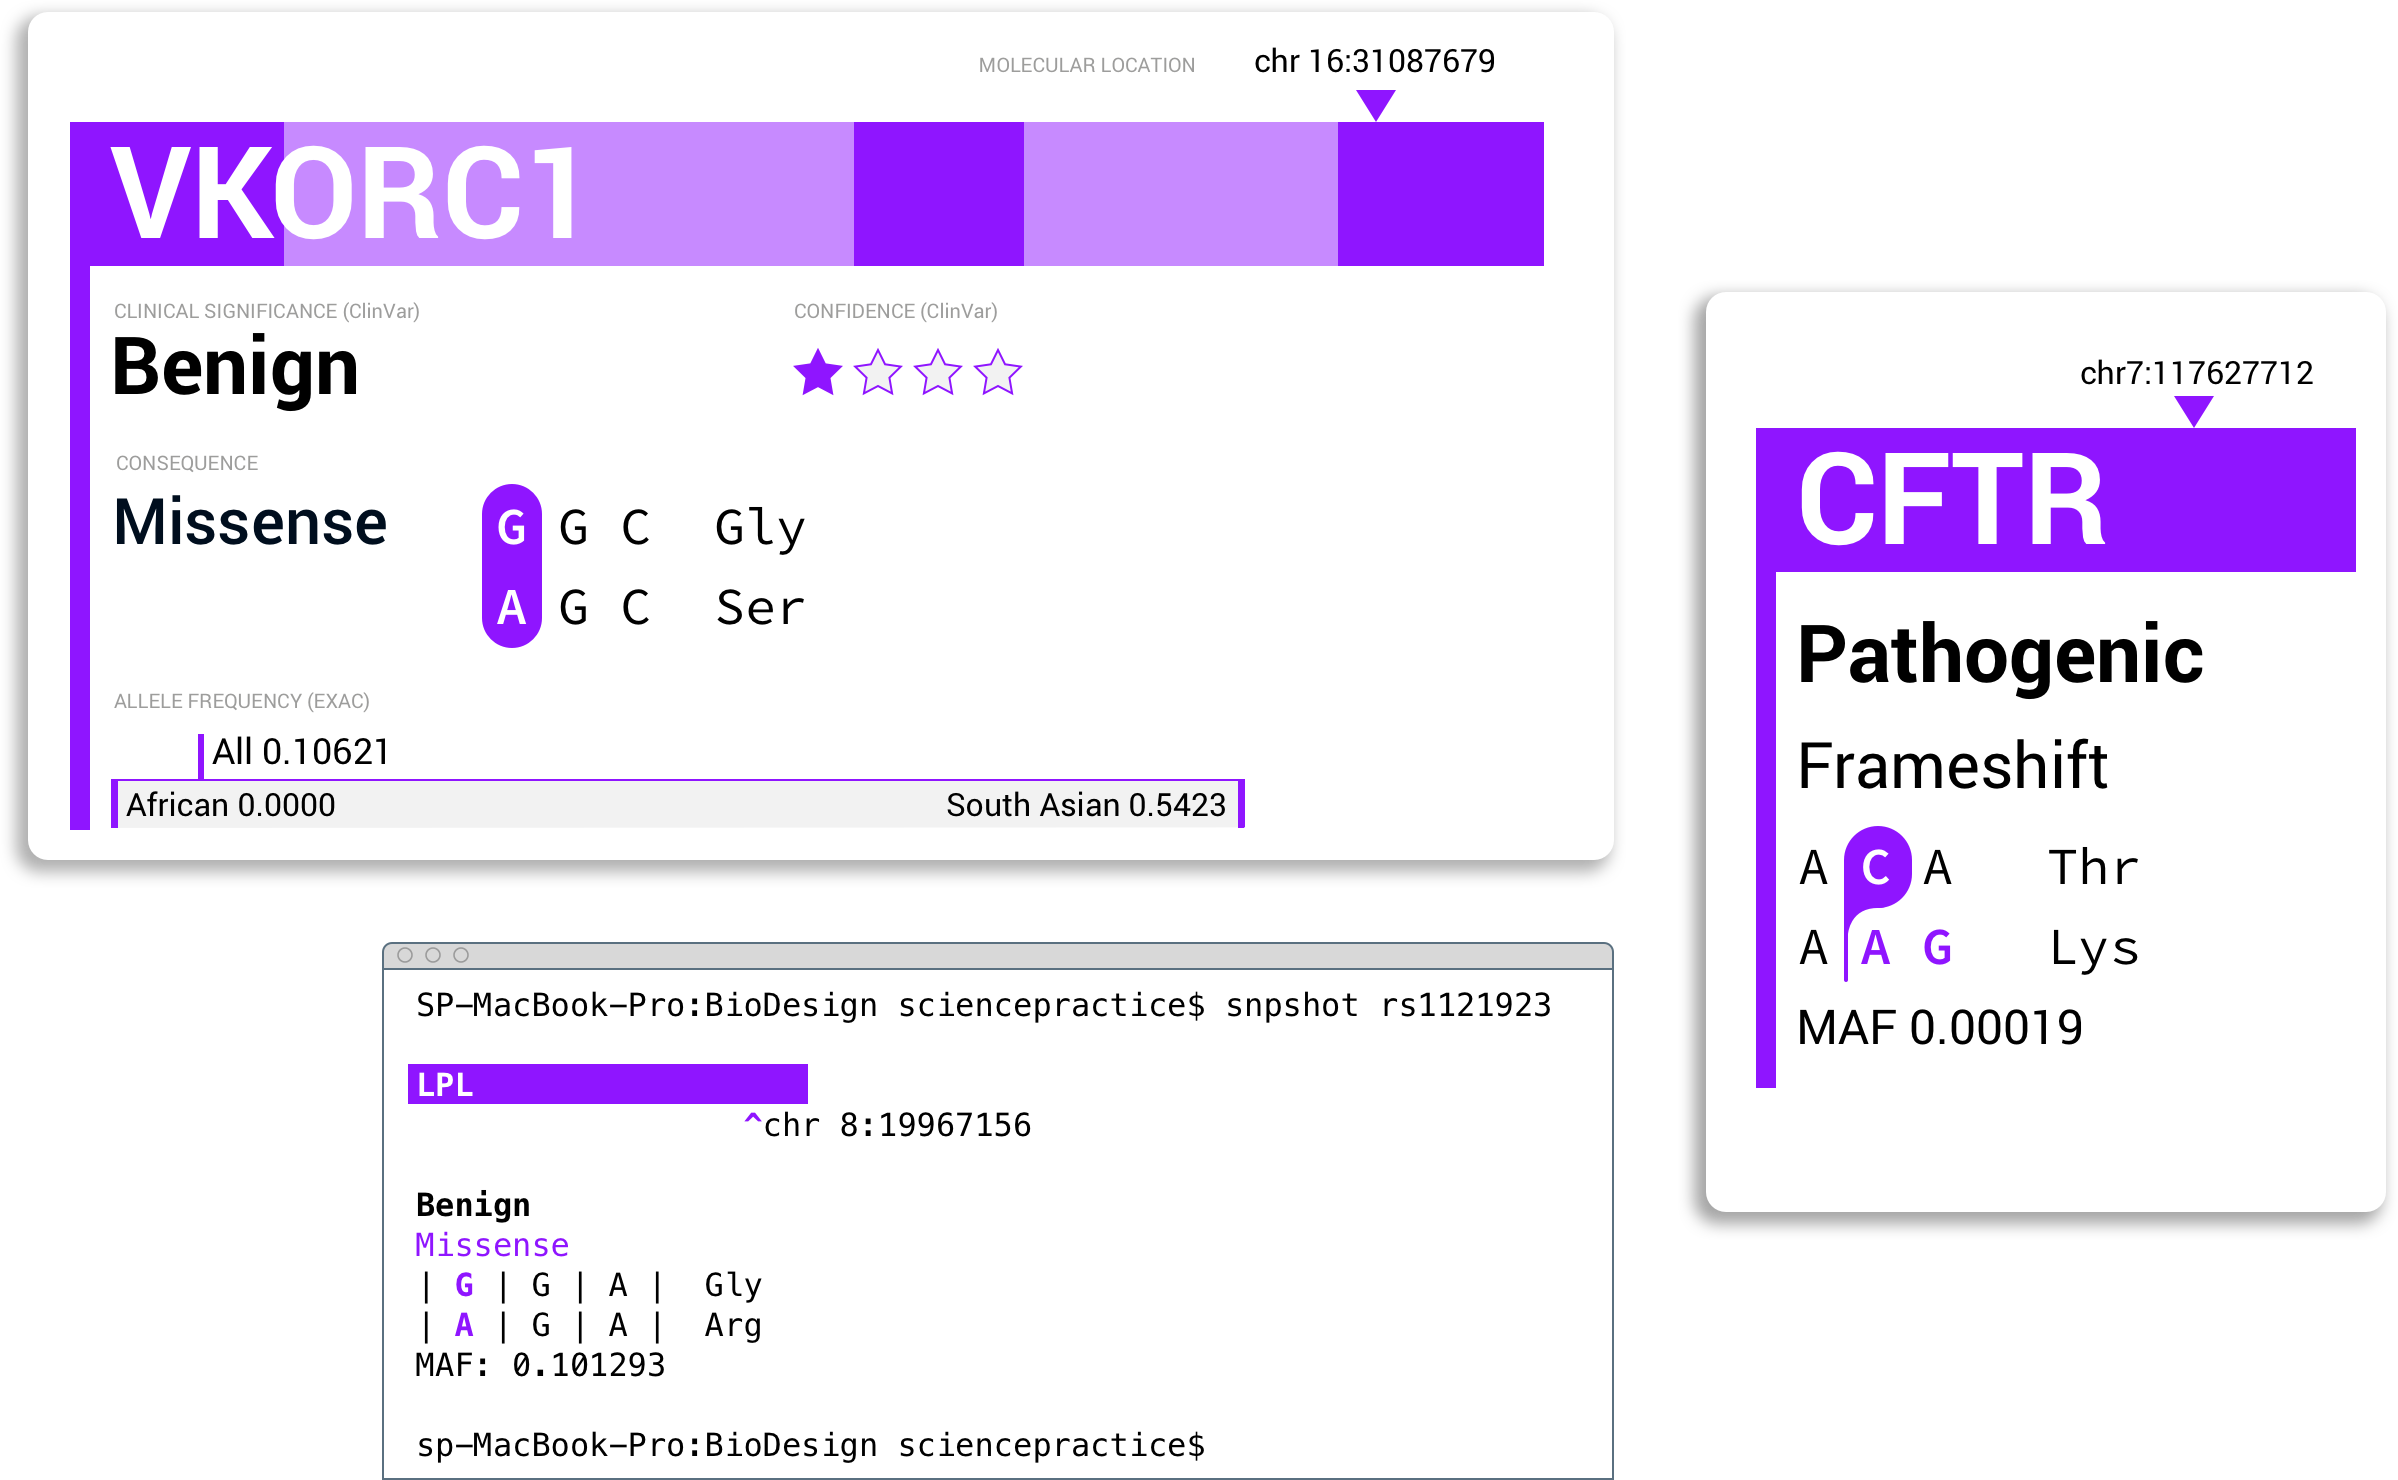
SNPshot could be used in different contexts. We think that the
Where in the genome?
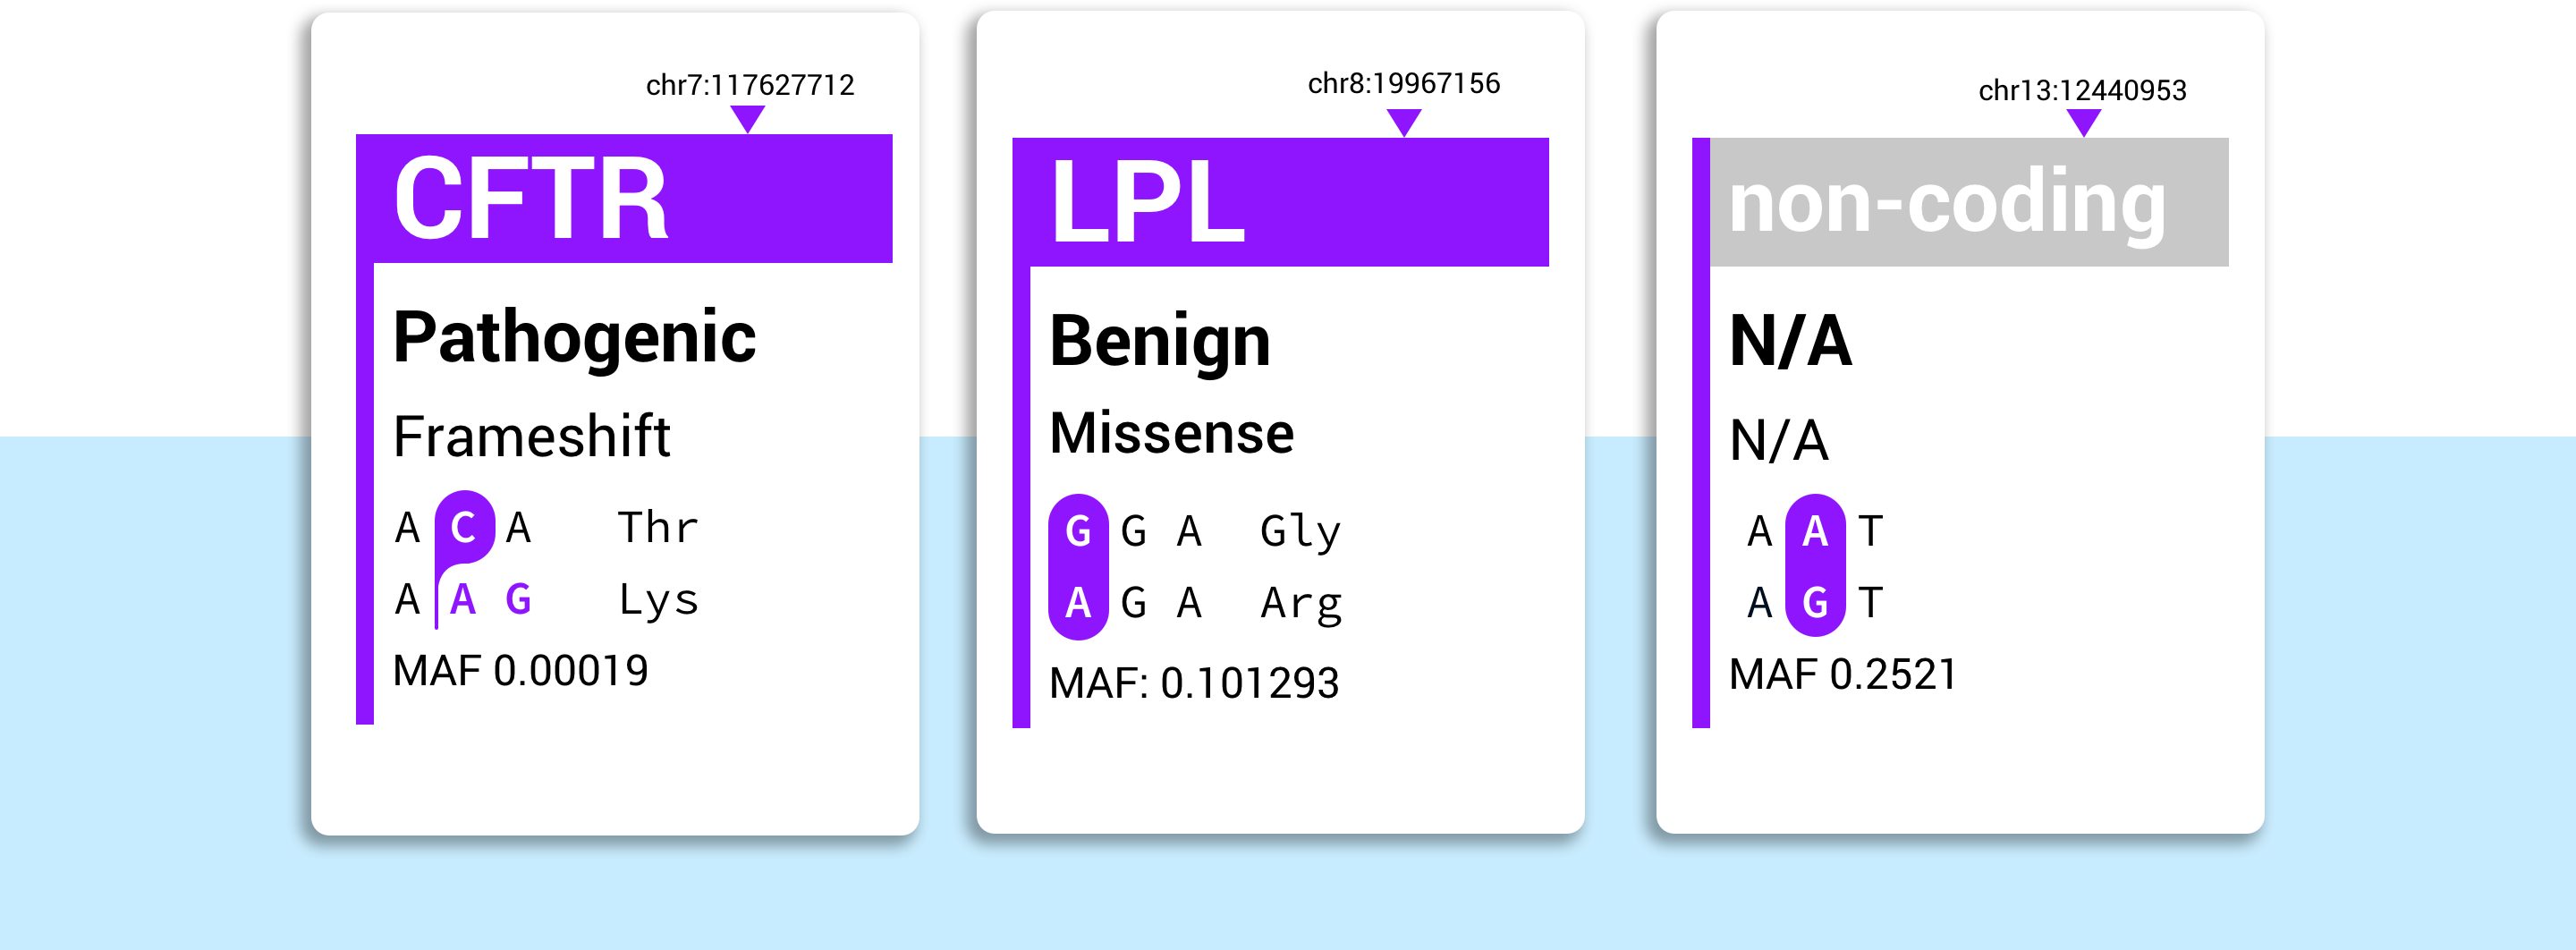
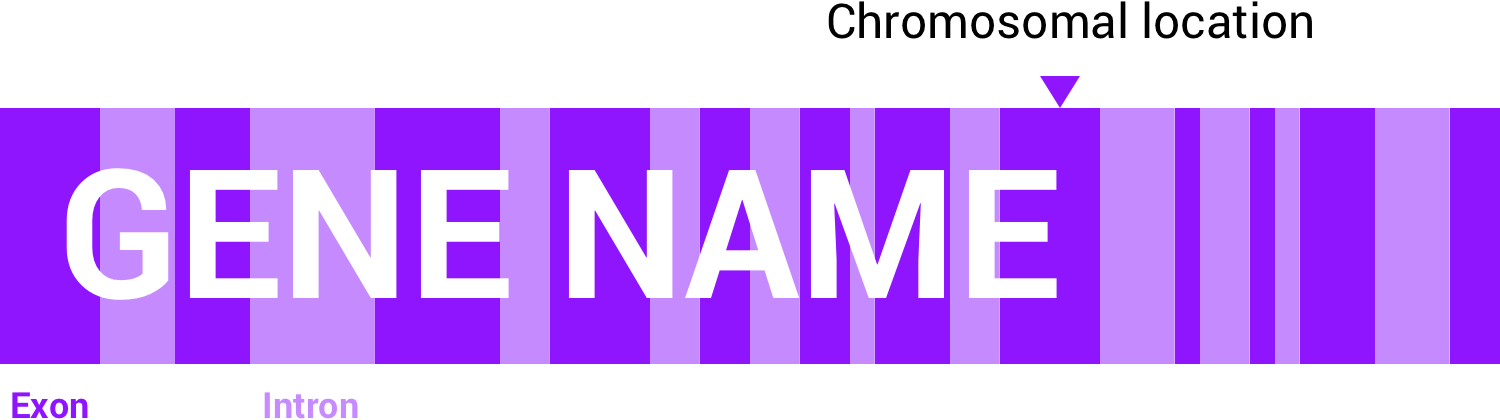
The most prominent information on the SNPshot is the name of the gene that the SNP is in. Although not unique, the gene name is crucial for orienting users, and is more memorable information than IDs such as rs numbers. The location of a SNP within a gene is indicated with an arrow. If space allows, the exons (dark purple) and introns (light purple) are also displayed. For those SNPs that are located outside of coding regions, the gene name displays as "non-coding".

What is the consequence?
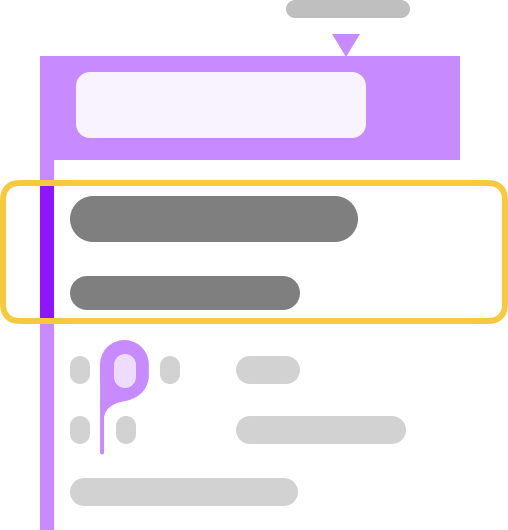
The aim for clinical geneticists is to identify the variants that are causing disease. Because of this we prioritised information about the pathogenicity and consequence of a SNP. This was given a very simple typographic treatment, and is second in the hierachy of information SNPshot provides.
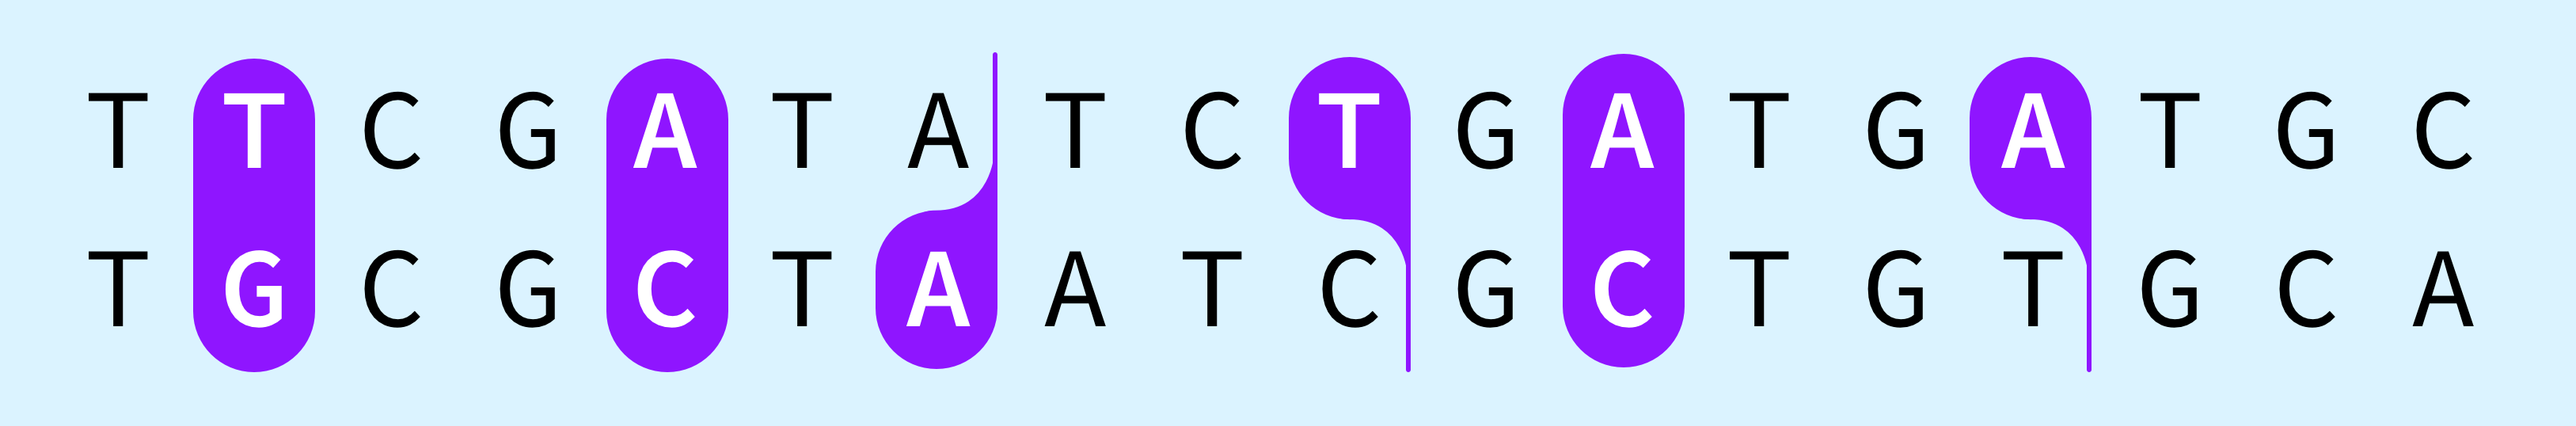
What was the change?
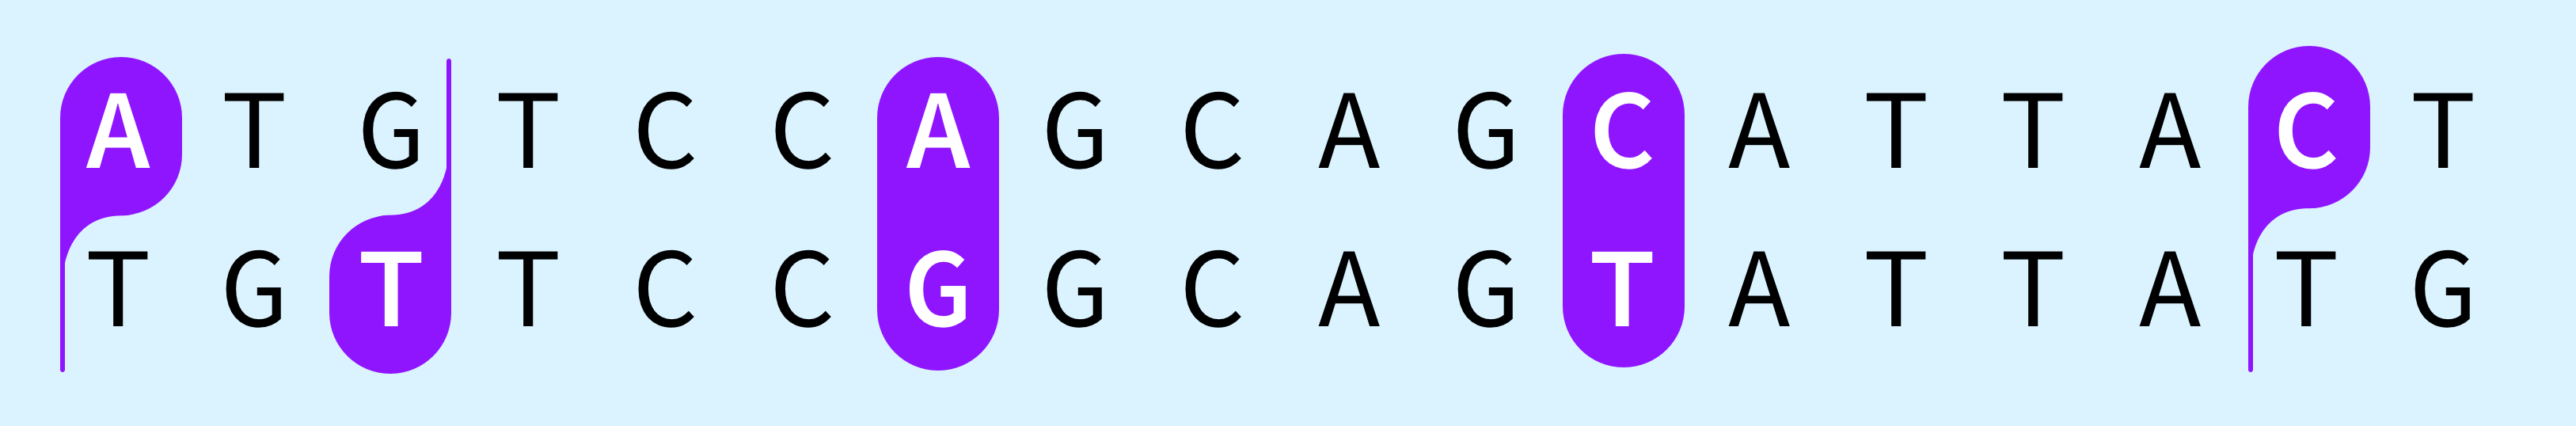
We wanted to create a clear, visual language to indicate the nucleotides affected by a SNP, including substitutions, insertions and deletions. For this we used a highlight effect showing the nucleotides directly impacted. Three nucleotides are shown, and the impact of the SNP on translated amino acids indicated. In the case of a frameshift, affected down-stream nucleotides are coloured purple.
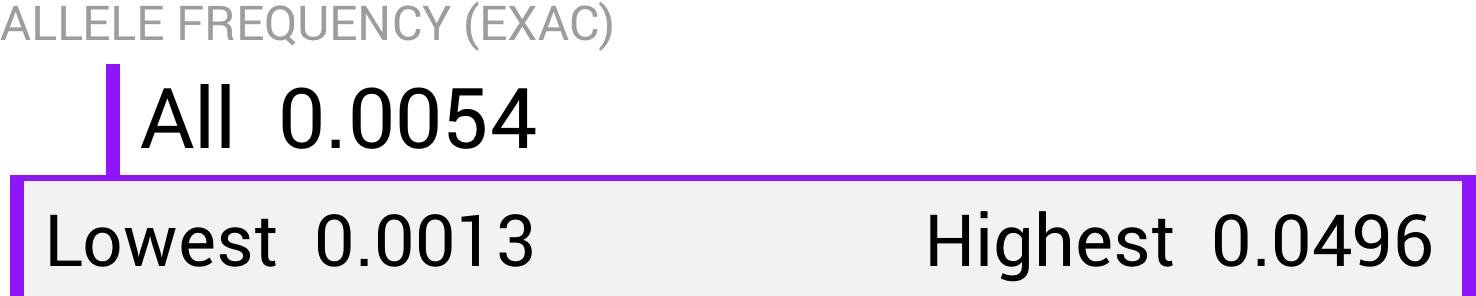
How common?
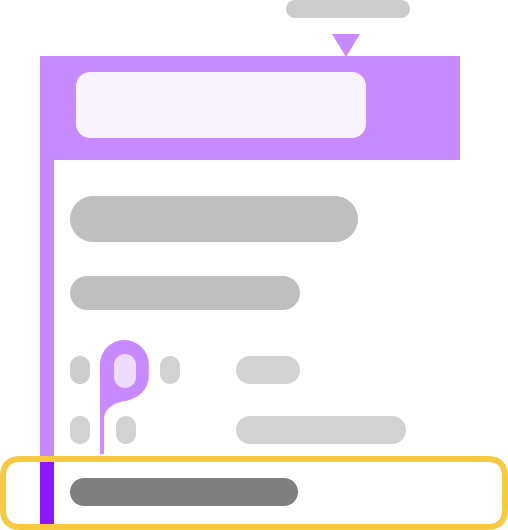
Allele frequency allows a quick assesment on the likelihood that a single variant could be enough to cause disease. This is ordinarily shown as a percentage and varies between populations of different ethinicity. For the expanded version of SNPshot we created a simple visualisation showing the maximum and minimum values for allele frequency, as well as the overall mean.
Traditionally, genetic databases try to be neutral when presenting information, and tend to be cautious of being opinionated or leading users. However, we believe work that introduces an information hierachy such as this proof of concept can be a great help to usability. By making the search for relevant information easier, SNPshot can act as an inital filter before deciding where to spend time investigating further.
As genetics becomes more widely used in healthcare and for informing lifestyle choices, it is important to make genetic information more accessible and help more people to take ownership of their genetic health.