
If a farmer wants to understand the health and fertility of their soil, they could send a sample to a lab for chemical analysis. This produces useful data, including levels of: 1) nitrogen, 2) phosphorus, 3) potassium and 4) pH. These data points can help the farmer decide which crop to grow, what type of fertiliser to use and how much to apply. But it’s well-known that soil is much more than a simple reservoir of farming nutrients. Soil contains millions of species of bacteria, fungi and archaea that form the most diverse and intricate ecosystems on earth. We wanted to understand whether a biological analysis of soil might complement the way that farmers understand their soil. So we’ve spent the last 6 months bootstrapping a soil genetics lab and running a proof-of-concept experiment using Oxford Nanopore’s MinION sequencer. Here’s what we found out.
Before we continue, we should mention that this is a long post… about 5000 words. We’ve provided a handy table-of-contents below to help you navigate. However, for those that want the TLDR version, here it is: We learnt a lot from this project. We discovered that it is possible to run sophisticated scientific experiments without your own lab space. We found signs that genetic sequencing of soil microbiomes could be a complementary addition to chemical testing. And we found that nanopore sequencing is an enormous leap forward in terms of usability of genetic research tools, but there are still a lot of technical problems to solve before biological analysis of soil could become a part of everyday farming practice.
Contents:
- Ways of learning about soil health
- Time for metagenomics
- Soil chemical testing: Getting our hands dirty
- Barcoding: Getting the most of our experiment
- As clear as mud: From soil sample to soil species
- Meeting point: Investigating our data
- The potential of sequencing
- Reflections
- Using MinION and Metrichor
- Conclusions
Ways of learning about soil health
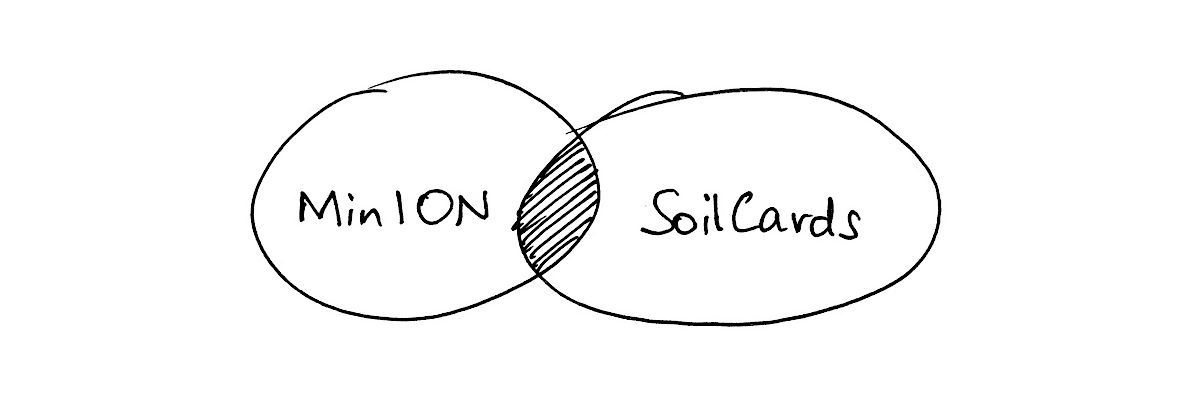
Over the past few years Science Practice has developed a strong interest in the measurement of soil health. This is primarily down to our work developing SoilCards: a paper-based soil diagnostic device that measures the key chemical indicators of soil nutrition: nitrogen (N), phosphorus (P), potassium (K) and pH.
When we got our hands on MinION — a genetic sequencer developed by Oxford Nanopore — we saw another opportunity to investigate soil health. Rather than measuring the chemical components of soil, could we use genetic sequencing to better understand its biological components? And, could this biological information tell us something about the quality and fertility of soil?
In addition to our interest in soil, we were also really keen to understand the usability of MinION. The ultimate aim of Oxford Nanopore is to allow anyone, anywhere to measure any living thing through its genetics. This meant that, as part of this experiment, we decided to also investigate how easy it was for us, a company without a lab, to run our own genetic sequencing experiments and analysis. We wrote about this particular side of the experiment in our ‘Genetic Sequencing with Distributed Labs’ blog post.
Time for metagenomics
MinION technology is based upon a biological structure called a nanopore. These are naturally occurring proteins that form pores through the surface of biological structures such as cell membranes. The key property of nanopores is that they allow some molecules, such as DNA, to pass through them. MinION works by embedding nanopores into a chip that can have an electric current passed through it.
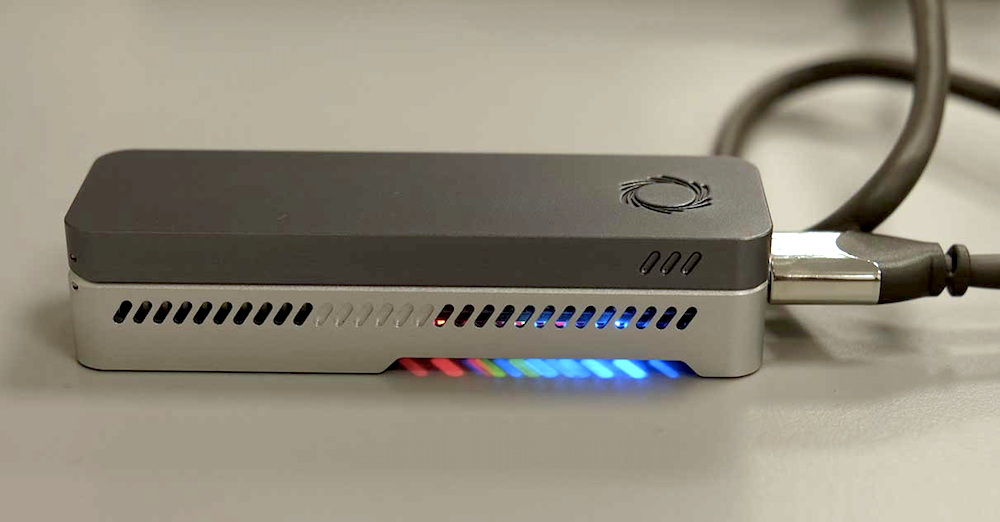
Our MinION in the Science Practice office.
When a DNA sample is added onto the surface of the chip (called a flow cell) and a current is applied, individual DNA molecules begin to move through the pores. As each DNA molecule moves through a pore, each different base (A, C, G, or T) produces a characteristic electrical signal which is sensed and recorded by the MinION.
This was not our first time using MinION. We have had two previous trial runs, one at Public Health England and another at the University of York – where we first tried sequencing DNA extracted from soil samples.
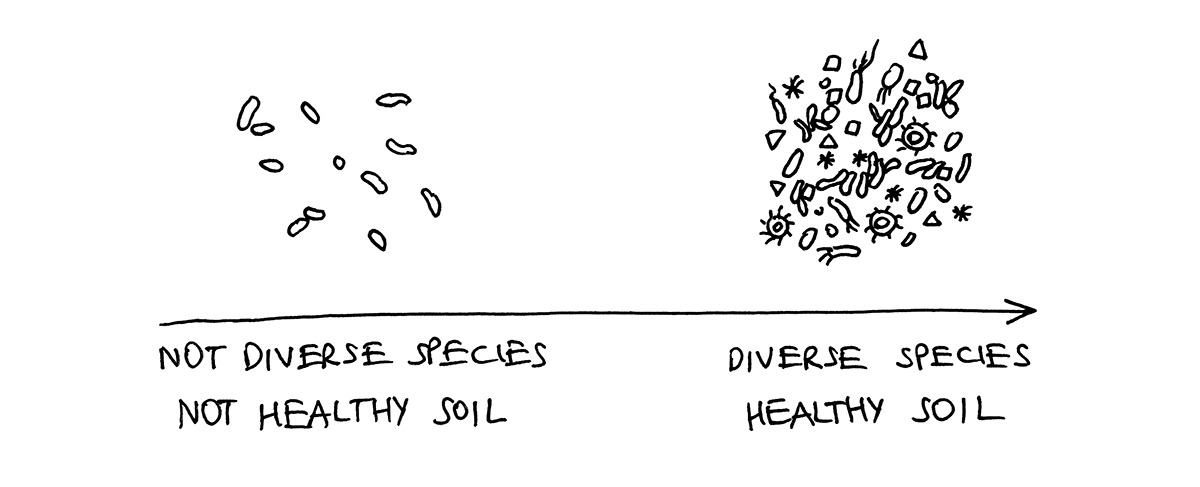
Soil is a good sample choice for a first genetic experiment for two reasons: it’s very easy to get hold of and there aren’t too many regulatory or safety concerns to complicate things. However, it did mean that instead of sequencing just one species, we would be attempting to sequence every microorganism present in a sample — something that is known as metagenomics. This approach allows you to gain an understanding of the diversity of species within a sample and, according to our hypothesis, an idea of the condition of the soil.
Soil chemical testing: Getting our hands dirty
To get started, we required a variety of different soil types. We decided to collect ten samples from a variety of different locations across London — from public parks to private allotments, and from open sports fields to hidden wildlife areas:
- Vegetable patch in Coram’s Fields
- Vegetable patch in Camden
- A flower pot (recently filled with compost)
- Finsbury Park
- Clissold Park
- Shoreditch Park
- Hampstead Heath
- Lea Valley Park
- Hackney Marshes
- Victoria Park
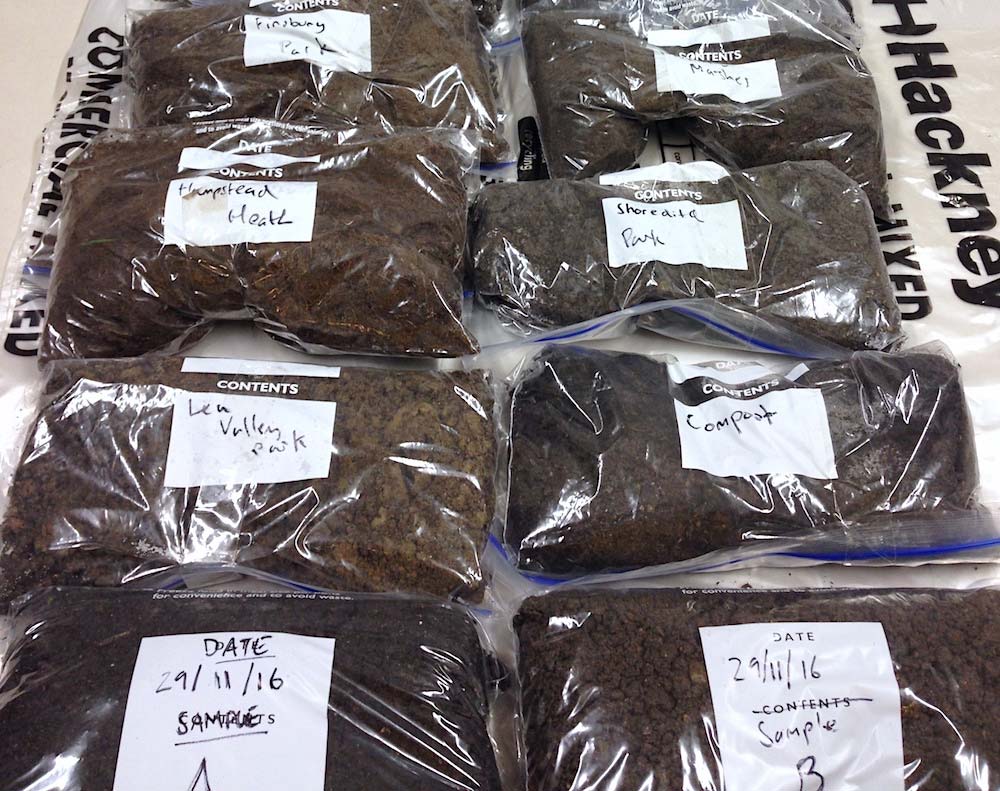
Soil samples before being sent for chemical analysis.
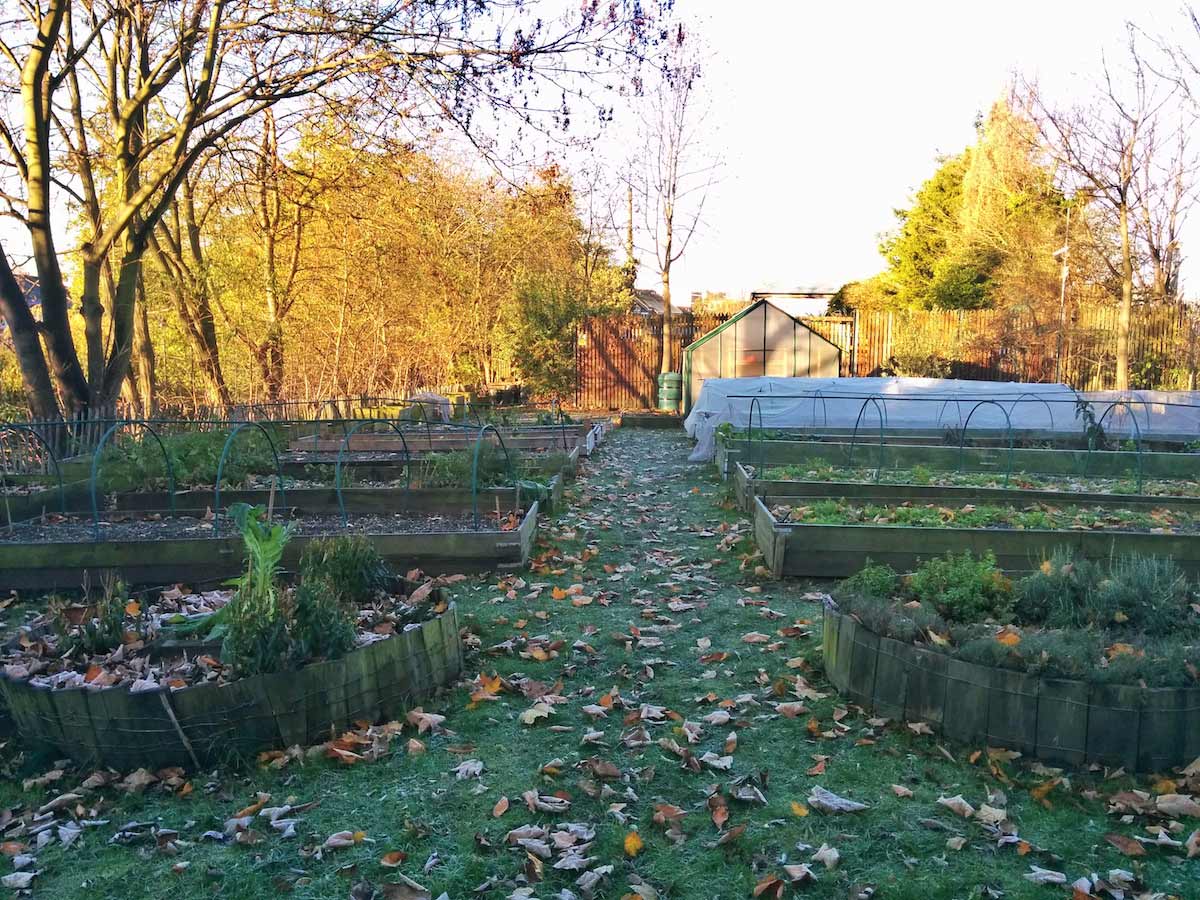
Allotments in Camden: vegetable patches with cultivated and fertilised soil.
According to existing chemical data on geological maps of London, as well as our own qualitative observations, these samples were meant to represent a spectrum of different soil types. For example, some soils came from cultivated areas, some from marsh land, and others from much drier locations. However, to have a true picture of their chemical diversity, we sent each sample off to be professionally tested by Anglian Soil.
Here is the summary of the results we received from Anglian Soil (‘Site details’ are based on our field notes taken while collecting the samples):
| Site code | Site details | |||||
|---|---|---|---|---|---|---|
| A | Coram's Fields Veg Patch | 7.00 | 121 | 510 | 58 | Site: vegetable patch. Cultivated. Fertilised. |
| B | Camden Veg Patch | 7.50 | 107 | 650 | 68 | Site: vegetable patch. Cultivated. Fertilised. |
| C | Flower Pot | 7.05 | 101 | 442 | 115 | Site: large garden flower pot with compost. Fertilised. |
| D | Finsbury Park | 4.15 | 69 | 180 | 58 | Site: park area. Growth: holly trees and bushes. Water: no open source within 20 metres. |
| E | Clissold Park | 7.25 | 57 | 560 | 47 | Site: from beneath decomposing logs. Water: stream within 10 metres. |
| F | Shoreditch Park | 7.45 | 149 | 420 | 43 | Site: patch of bare land. Growth: grass. Water: no open source within 20 metres. |
| G | Hampstead Heath | 4.15 | 47 | 236 | 73 | Site: top of Parliament Hill. Growth: long wild grasses. Water: no open source within 20 metres. |
| H | Lea Valley Park | 7.15 | 186 | 1299 | 101 | Site: next to a marsh. Growth: woods. Water: marsh/bog within 10 metres. |
| I | Hackney Marshes | 7.55 | 68 | 316 | 63 | Site: edge of sports pitches. Water: canal nearby. |
| J | Victoria Park | 4.60 | 173 | 253 | 138 | Site: park area. Growth: dense shrubs/woods. Water: lake within 10 metres. |
To better understand the differences and similarities between our samples, we visualised our results in a parallel coordinates graph using RAWGraphs. As can be seen below, some interesting clustering of samples emerge immediately.
There are two distinct groups based on their acidity levels: three samples with pH levels below the 5.0 value and seven with their pH levels equal or above 7.0. There are also three distinct groups forming based on the levels of phosphorus (P) and nitrate. Interestingly, the potassium (K) values seem to be quite different across all ten samples, with only one major cluster caught in bucket number 4.
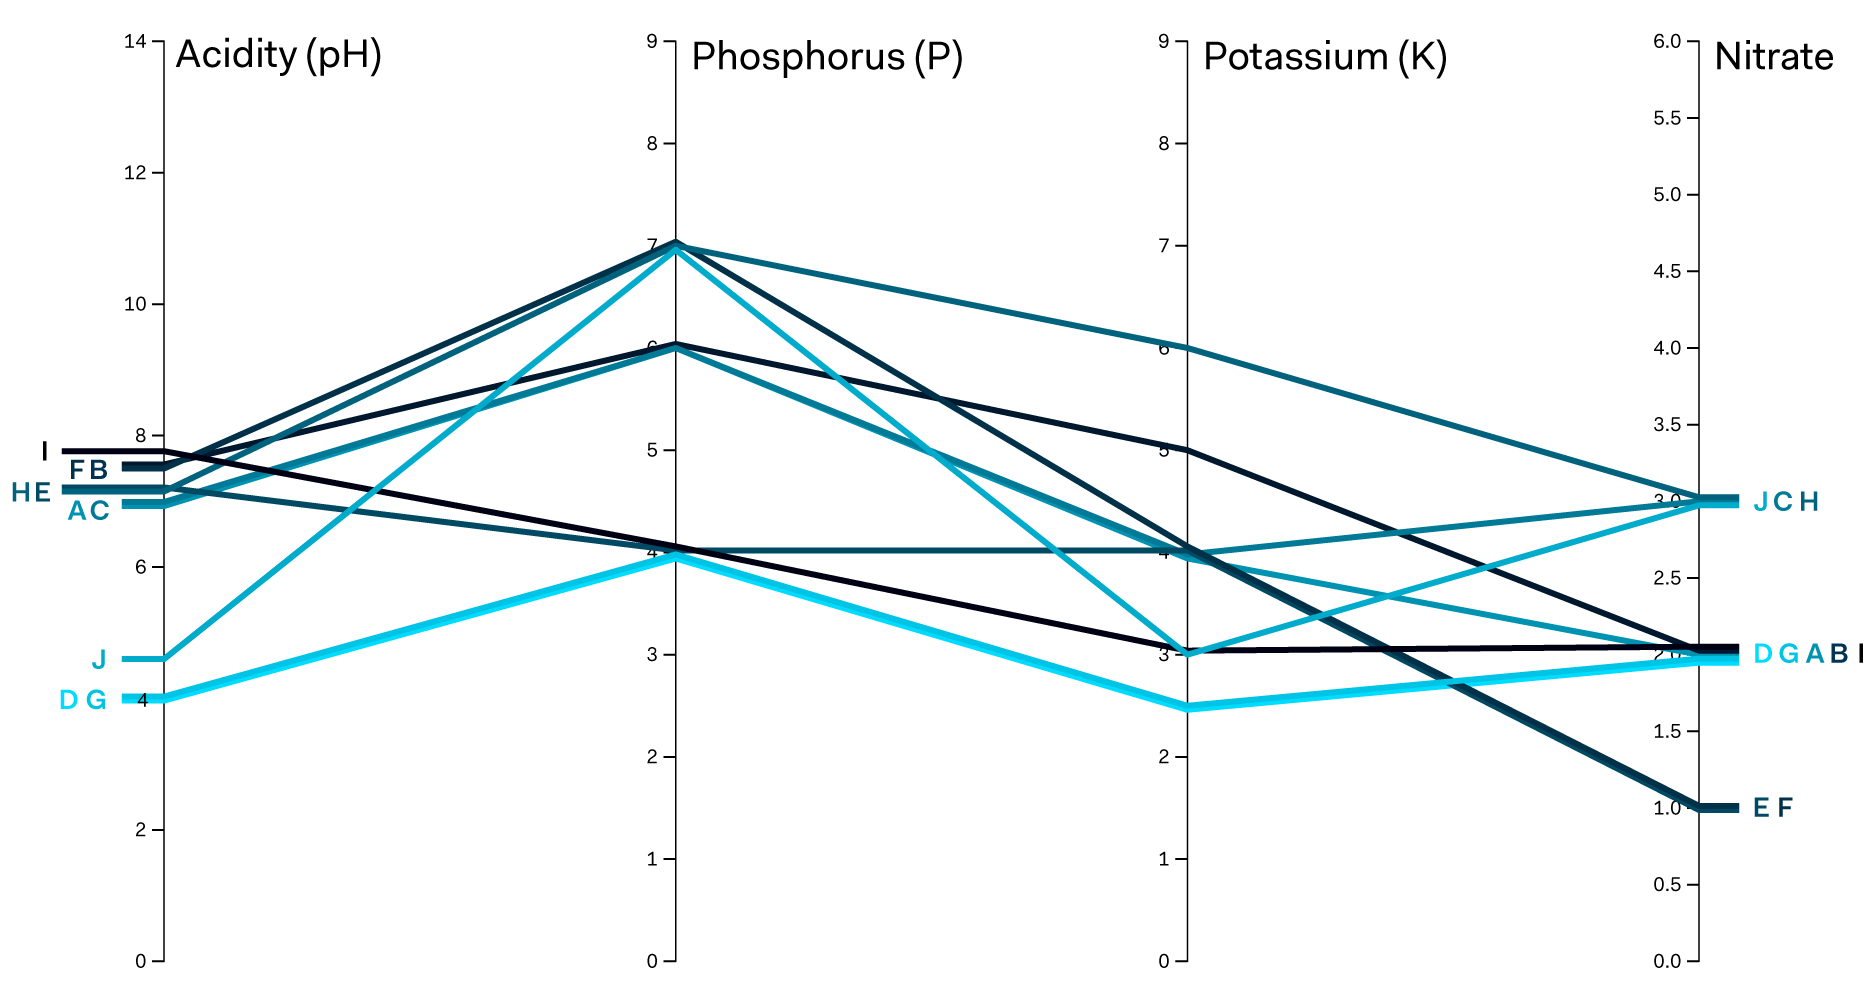
Visual comparison of soil samples according to four key chemical properties: pH, P, K, and N levels. Anglian Soils group similar values from chemical testing, which we have used to plot each sample.
Barcoding: Getting the most out of our experiment
For our experiment we wanted to try and test as many samples as possible with our two flow cells (this is because there is a limit in the number of times a single flow cell can be used). Because of that, we decided to use a technique called barcoding, which allows the addition of more than one sample to the same flow cell.
DNA barcoding works by chemically adding known genetic sequences to the ends of all of the DNA molecules in a sample. Each sample receives a different barcode; this means that after the sequencing is done, it is possible to identify which piece of DNA came from which sample using bioinformatic software.
Barcoding forces a decision between increasing the number of samples versus the quantity of data for any one sample. This is because there is a limit to the amount of DNA that can be added to a flow cell, meaning that each new sample in effect ‘dilutes’ the other samples analysed. It is possible to add up to 12 different samples onto a flow cell, but we compromised at 5 per flow cell.
As far as we know, we were one of the first people to try using barcoding to analyse metagenomes with MinION. We wanted to do this to increase our sample number for the experiment and to increase the power of our proof of principle experiment to be informative. However, the cost of diluting samples for barcoded metagenomic analysis is that it may prevent the detection of rarer species in a sample.
As clear as mud: From soil sample to soil species
Oxford Nanopore provide a cloud based analysis service called Metrichor for users of MinION. This includes applications that can separate data with different DNA barcodes into different files, and another called What’s in My Pot (WIMP) that matches sequences to bacterial, fungal, viral or archaea in a database of genomes from different species.
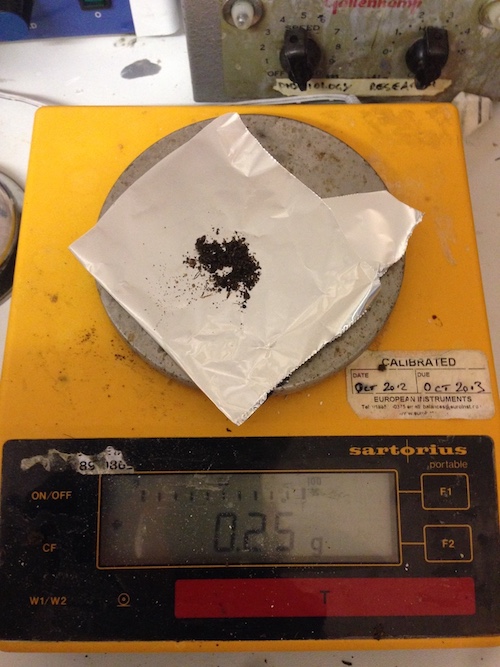
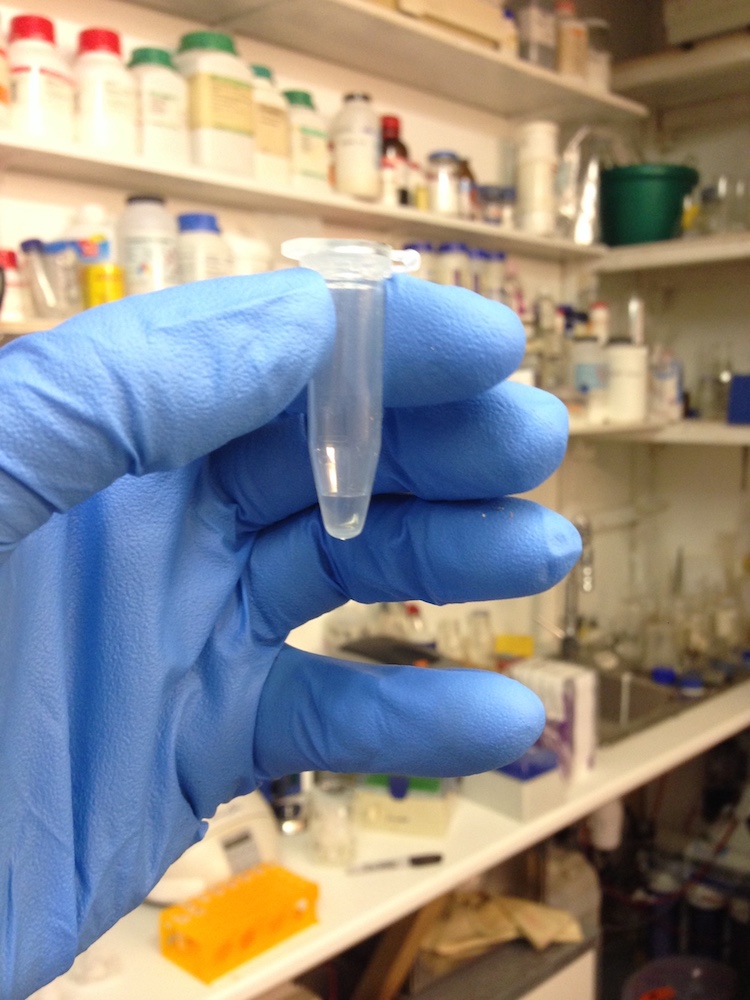
Left: Weighing out soil samples before DNA extraction. Right: DNA sample in the BioHackspace Lab.
Preparing the sample for sequencing on our first flow cell was seemingly uneventful. At first, it appeared we had large amounts of data to analyse and each DNA read (individual molecule of DNA that passed through the flow cell and was read by the sensor) successfully separated into its appropriate barcode. However, when it came to using WIMP to identify which species each read came from, a disappointingly low percentage of the total could be matched.
There are a few potential reasons for the low percentage of matched reads in the data. The fragments of DNA we had were relatively small, which makes it more difficult for WIMP to identify their species of origin (WIMP does not attempt to match reads below 700 base pairs in length). The short fragments may have been a result of the DNA extraction process used for soil, which is relatively abrasive, or of the repeated freeze/thaw cycles, as we stored the DNA in between the different steps of the sequencing preparation process. The standard protocol for MinION does not require storing DNA, however, as our distributed lab was working in more than one location, it was necessary to pause the experiment at certain points.
For our second flow cell we went from DNA to sequencing in as short a period as possible, avoiding freezing the sample. Unfortunately, our sequencing run was interrupted overnight, resulting in a very low quantity of data.
Despite these setbacks, we were able to use WIMP to identify distinct species in four samples. This allowed us to begin to make observations of correlations between chemical and microbiological data.
| Site code | Sample site | Number of species identified by WIMP |
|---|---|---|
| A | Coram's Fields Veg Patch | 190 |
| B | Camden Veg Patch | 133 |
| D | Finsbury Park | 106 |
| I | Hackney Marshes | 106 |
Meeting point: Investigating our data
At this stage of our experiment we had at our disposal three types of data for analysis:
- Data about the chemical properties of each of the ten samples from soil chemical testing by Anglian Soil,
- A list of different species identified by WIMP from our MinION metagenomic sequencing,
- Observational data about soil location, condition, and treatment made at sample collection.
We decided to proceed with the analysis of only four samples (A, B, D, I) for which we had all three types of data available.
We started by trying to better understand the similarity between soil samples. To do this, we decided to use Principal Component Analysis (PCA). PCA is a statistical procedure developed in the early 20th century. It goes by different names in different fields, and is currently in the limelight of machine learning. One of its uses is in visualising multi-dimensional data. As we had four soil samples and six chemical features (magnesium, phosphorous, potassium etc.), PCA allowed us to visualise this 6-dimensional dataset in a 2-dimensional graph.
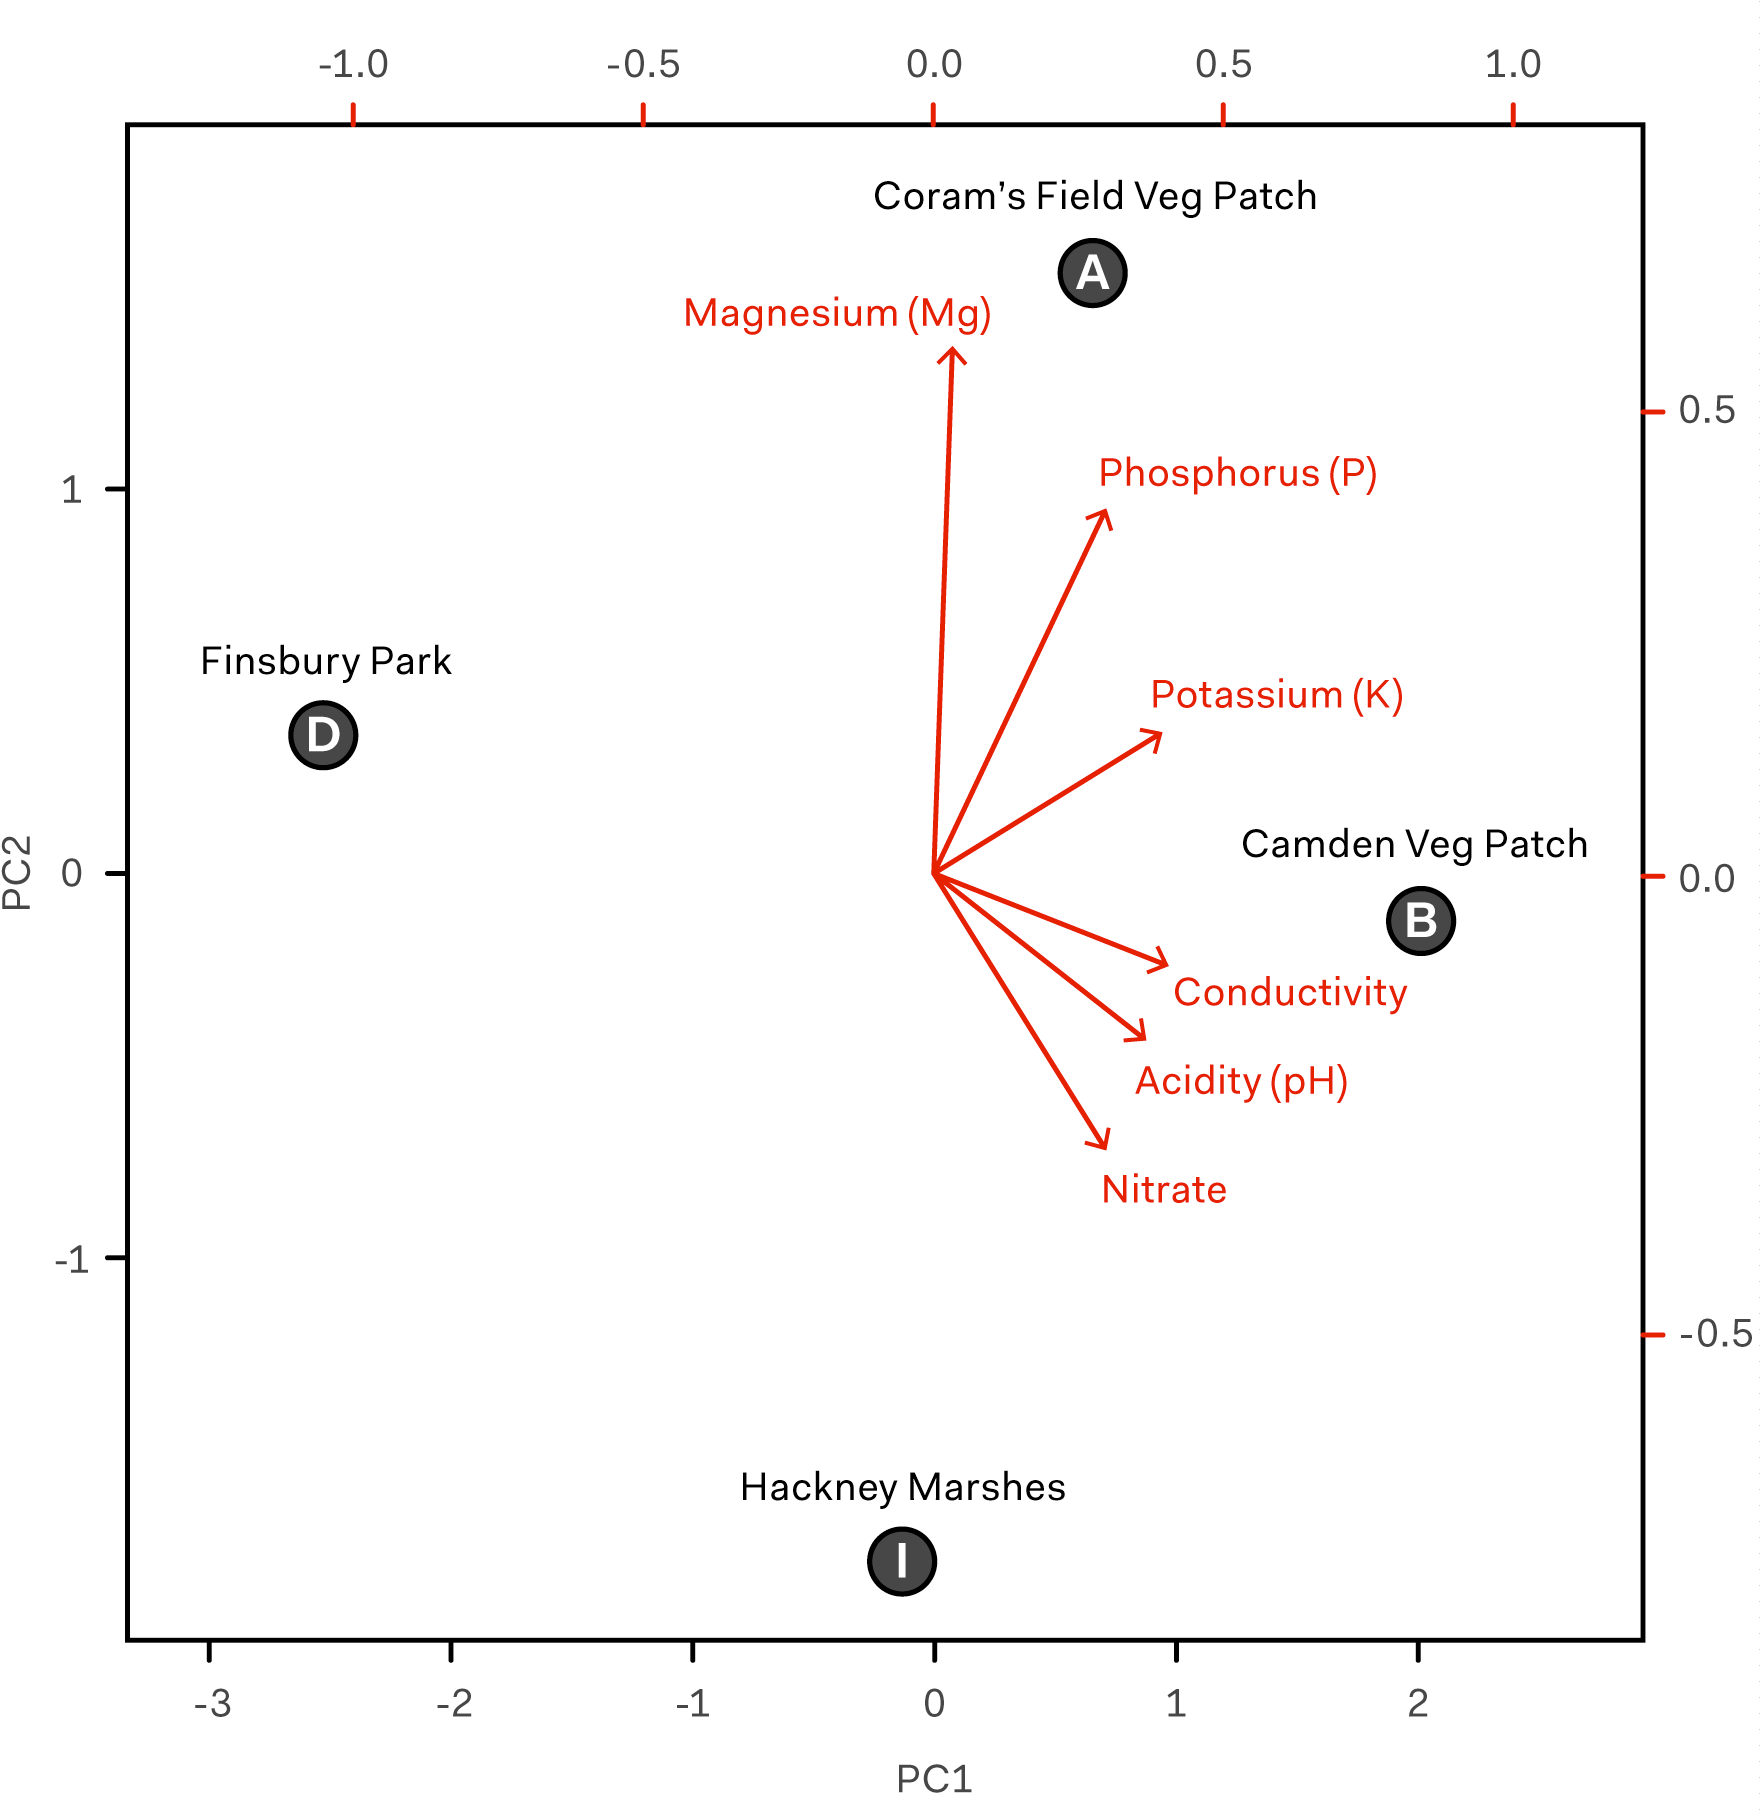
Principal Component Analysis biplot generated in R to map the position of four soil samples (A, B, D, and I) in relation to six chemical properties measured by Anglian Soil: acidity (pH), phosphorus (P), potassium (K), nitrate, magnesium (Mg), and conductivity.
We transformed the original features into principal components that efficiently accounted for as much of the variability in the data as possible. We then picked the first two principal components for plotting purposes; in this case, they accounted for 93% of data variability. The six original chemical features (vectors in red) are the loadings of each soil metric on the first two principal components (PC1 and PC2). The four chosen soil samples (labels in black) are the scores of each soil sample on the principal components.
On the biplot, soil samples that are close together correspond to observations that have similar soil chemistries. Based on the more important PC1 (x-axis), the soil samples from Finsbury Park (D) and the Camden Veg Patch (B) have the least in common. The most chemically similar samples are the two vegetable patches (A and B).
Although our power to make strong conclusions is limited, the data does point to some interesting correlations that would be worth pursuing and validating in further experiments. For example, based on the results of our metagenomic sequencing, the most biodiverse samples were the soil samples taken from vegetable patches (A and B). Biodiversity in soil microorganisms is an indicator of soil health, which also correlates with our chemical data showing good levels of nitrogen, phosphorus, potassium and other nutrients. A and B were also the only samples that were taken from soil that was cultivated.
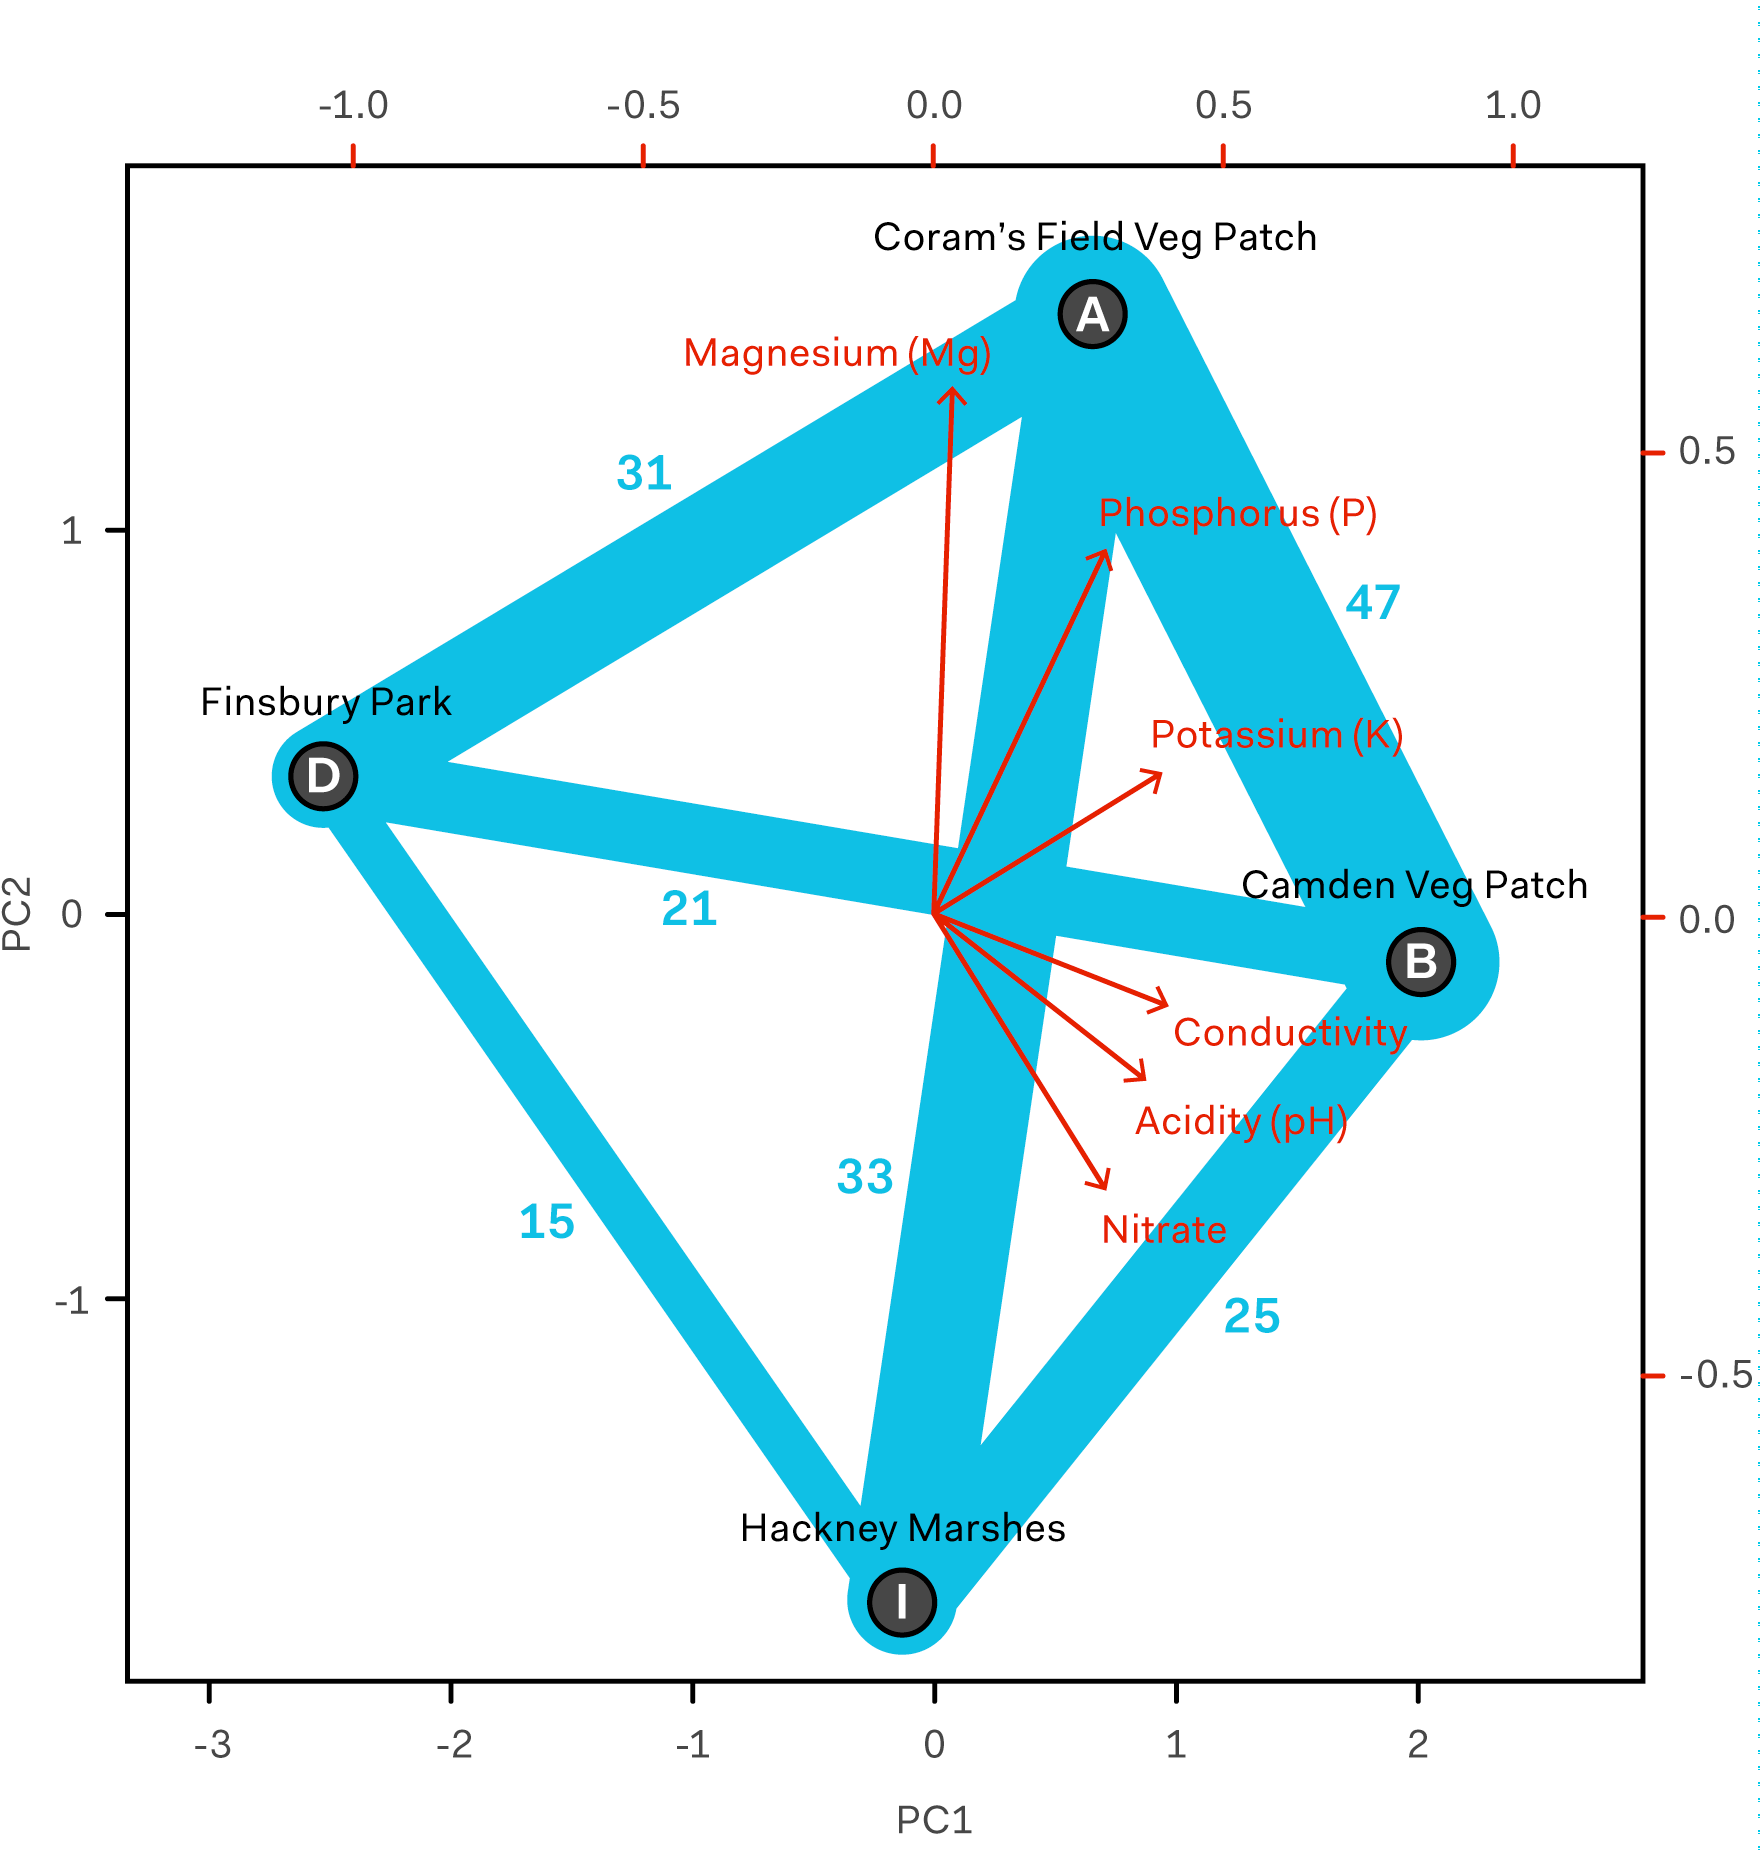
Species shared between each site pair (including those not exclusive to each pair). The number of species shared between given site pairs is labeled in blue and indicated by the thickness of the blue connecting lines.
Overall, shared species between pairs of samples also showed interesting possible correlations. We calculated the Sørensen–Dice coefficient for each pair of samples. The Sørensen–Dice coefficient is a simple statistical method to compare similarity between samples. Values are between 0 and 1, with 0 representing absolute difference and 1 representing absolute similarity (sample pairs in table below ordered from most similar to least similar).
| Site code pair | Sample site pair for comparison | Sørensen–Dice coefficient |
|---|---|---|
| A – B | Coram's Fields Veg Patch – Camden Veg Patch | 0.146 |
| A – I | Coram's Fields Veg Patch – Hackney Marshes | 0.111 |
| A – D | Coram's Fields Veg Patch – Finsbury Park | 0.105 |
| B – I | Camden Veg Patch – Hackney Marshes | 0.105 |
| B – D | Camden Veg Patch – Finsbury Park | 0.078 |
| D – I | Finsbury Park – Hackney Marshes | 0.071 |
This method showed us that the most similar samples in terms of shared species were the vegetable patches (A – B); this matched our expectations from the chemical data. The most dissimilar samples were Camden Veg Patch and Finsbury Park (B – D), and Finsbury Park and Hackney Marshes (D – I). Camden Veg Patch and Finsbury Park are the most chemically dissimilar samples, but we would not have predicted that Finsbury Park and Hackney Marshes would have such distinct biological makeups. These samples are broadly similar chemically, however they have a significant difference in their pH values, something that could impact the microbial species represented.
We are treating correlations observed with caution. There is an intriguing possibility that samples that are similar chemically are also similar in terms of their shared species, but we do not have sufficient evidence to know if this is consistently detectable using MinION.
Unfortunately, it is not clear if the types of species that are shared between samples have similar roles in relation to soil. This, combined with the fact that conducting chemical tests is simpler and cheaper than sequencing, make it unclear whether this kind of broad species diversity measure adds value over chemical testing.
Currently, the actions available to somebody attempting to respond to soil health data are not generally capable of responding to data as granular as microorganismal species makeup. In this respect, improving access to chemical testing through products such as SoilCards, which we are working on separately, is a lower hanging fruit in terms of likely impact.
The potential of sequencing
It is true that species data is significantly richer than chemical. Available databases store a great depth of information on different species, including details about metabolism, growth conditions (including temperature and pH), pathogenicity, and more. This information could allow certain species to act as bio-indicators of specific properties of soil.
For example, species with roles in the nitrogen cycle, plant or human pathogenicity, or those that metabolise soil environmental contaminants could all act as indicators. However, isolating and drawing meaningful conclusions from this data for non-experts is a long-winded process, reliant on databases having the sufficient information to understand an organism’s role in soil.
For instance, there were numerous strains of Variovirax Paradoxus identified in all samples. This type of bacterium is known for its ability to metabolise a wide variety of pollutants in soils, promoting plant growth in otherwise contaminated soil. This is consistent with the fact that all samples came from London locations, as soil in cities is likely to have a large number of pollutants.
Also of potential value is information about crop or human pathogens. For example Janthinobacterium Agaricidamnosum is a type of bacteria that causes rot in cultivated mushrooms. All samples barring the Finsbury Park one (D) showed evidence of this bacteria, indicating that (all other things being equal) Finsbury Park could be a good spot to begin farming Portobello Mushrooms. Although this is said slightly tongue-in-cheek, it is not difficult to imagine that sequencing could be used to identify causes of disease in crops and aid treatment decisions.
We were interested to investigate if we could segregate different soil samples based upon the numbers of species observed with involvement in the nitrogen cycle. Our data did not allow clear segregation as all samples barring Finsbury Park (5%) had ~8% of species known to have a role in the the nitrogen cycle. Nevertheless, this line of analysis could produce highly relevant information for soil management, especially if combined with a quantitative knowledge of abundance of each species.
These specific stories are risky to be confident in. Validating species as bio-indicators would be a significant task. It is however a concept that deserves further investigation, as it could allow for a much richer understanding of soil.
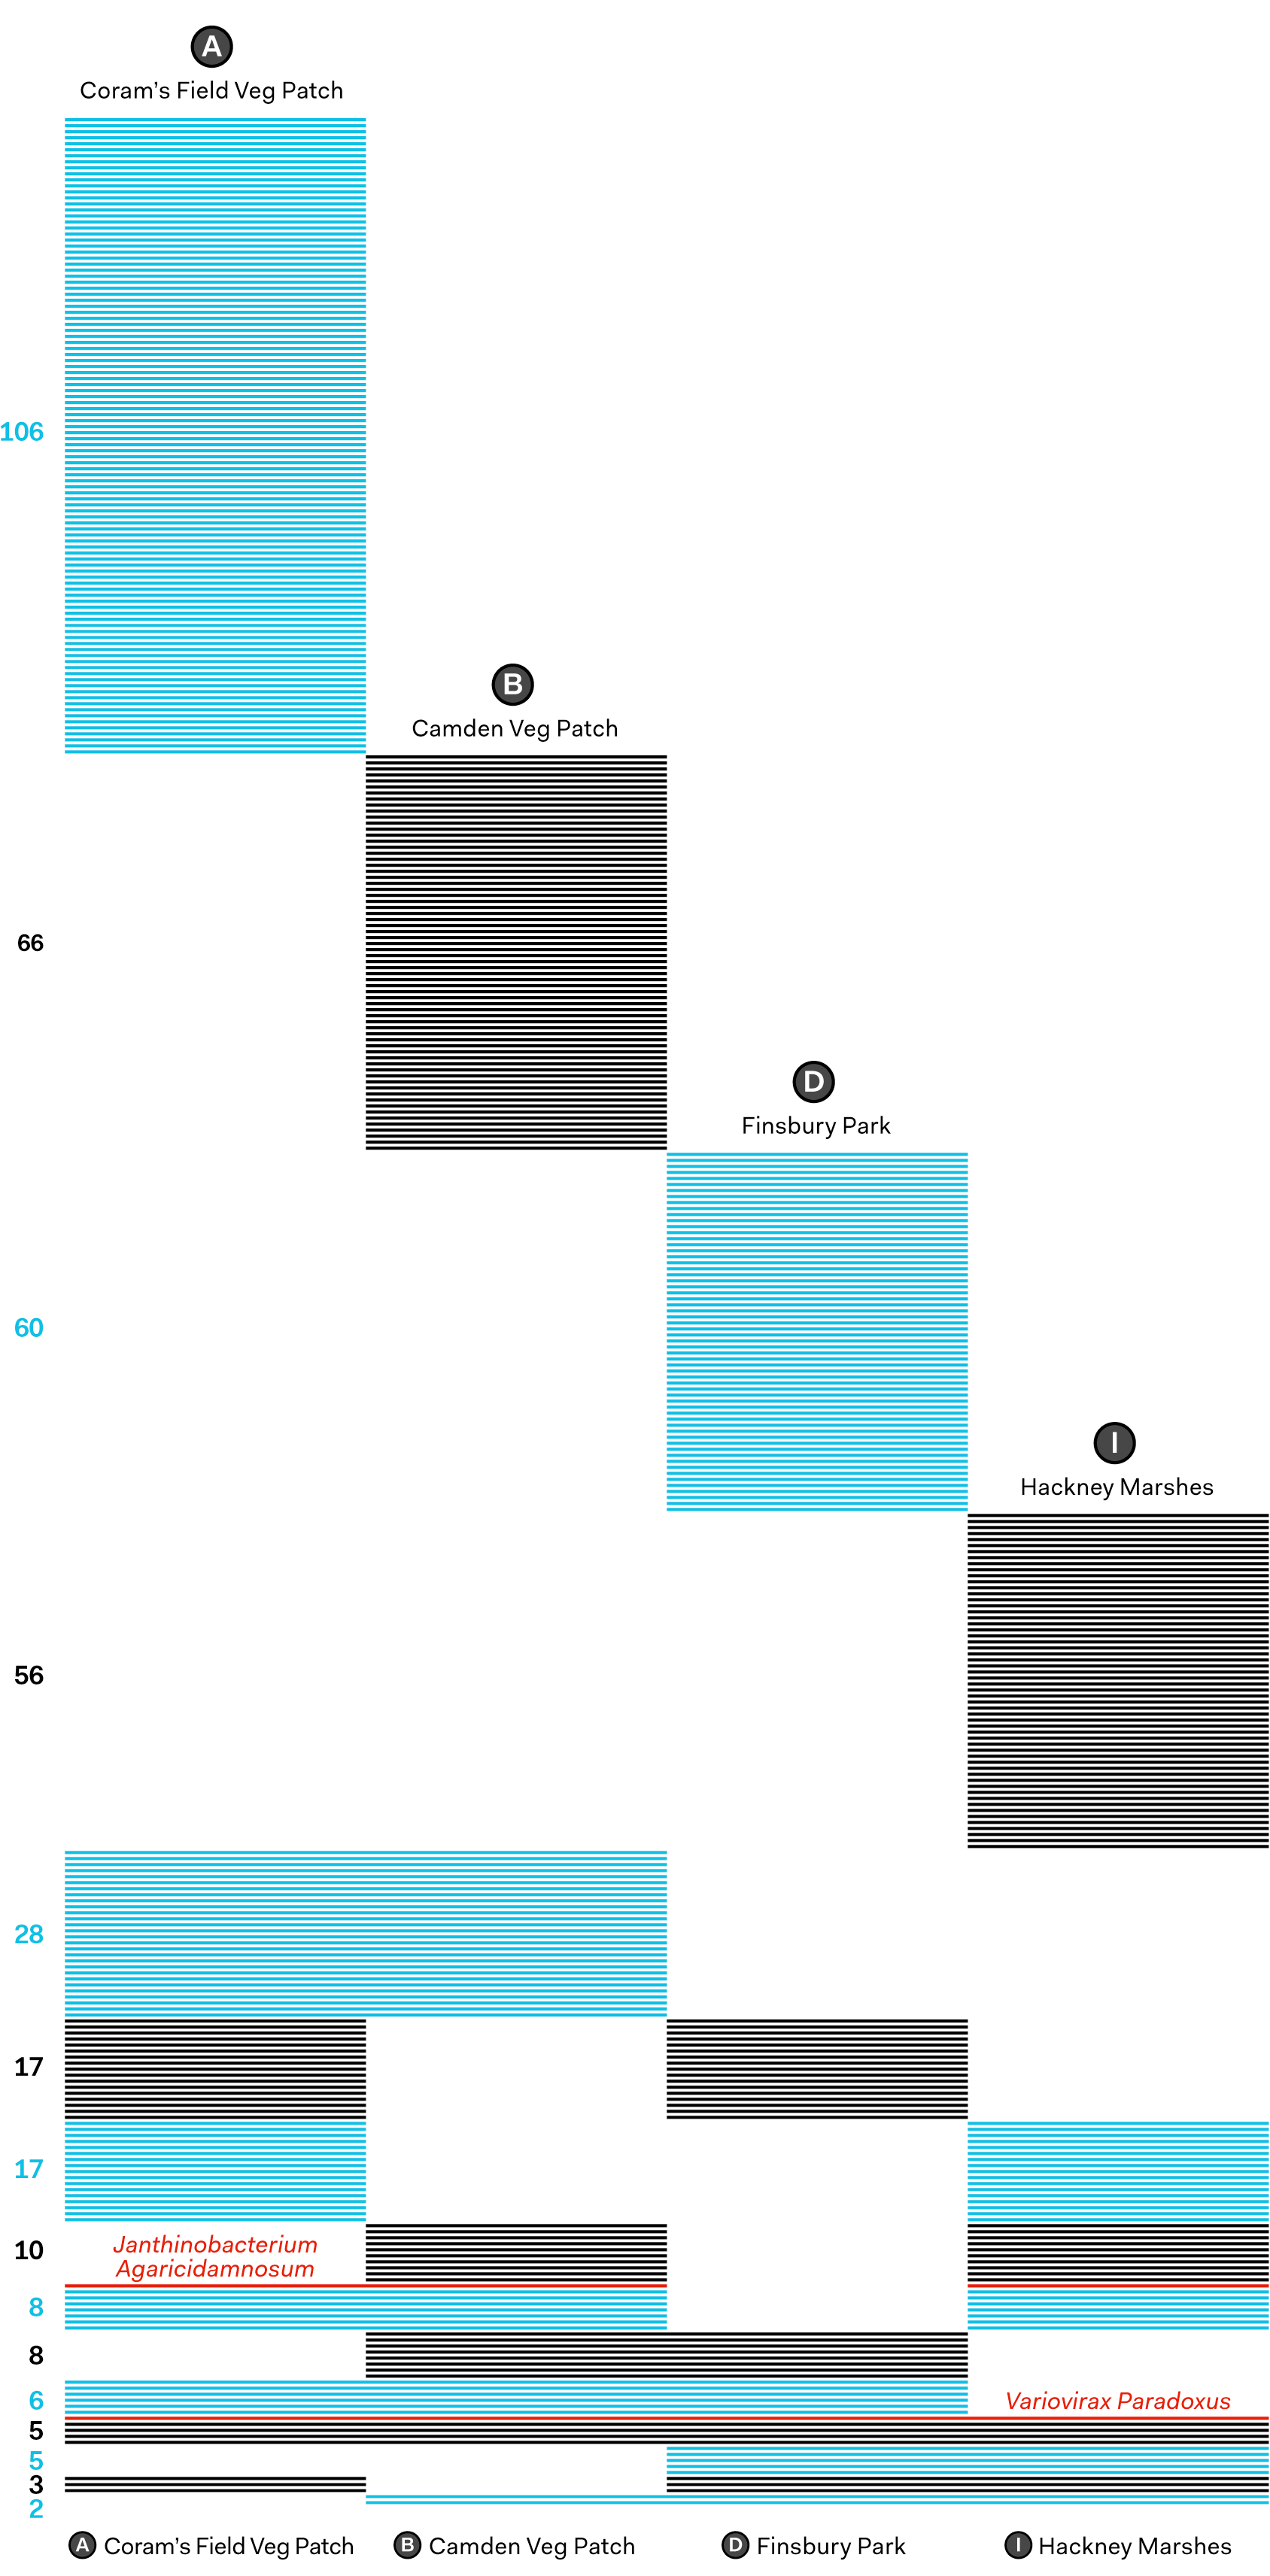
All species identified by MinION metagenomic sequencing by site. Each line represents an individual species of bacteria, virus, or fungi. Numbers on the left indicate the number of species per each site configuration (e.g. there are 28 species that only sites A and B have in common). Two species discussed above are highlighted: Janthinobacterium Agaricidamnosum found in sites A, B and I, and Variovirax Paradoxus present in all four sites.
Reflections
It is not entirely novel to attempt to sequence genomes found in soil. What is (to our knowledge) more unusual is the use of MinION nanopore sequencing. This technique allows direct sequencing of a sample, without the amplification of certain highly variable areas of the genetic code. MinION makes it simple to look at all types of microorganisms from bacteria, through fungi and viruses, to invertebrates in the same experiment.
Our experience was that the vast majority of species identified were bacteria. It was not clear if MinION sequencing is an effective way to capture all types of microorganism at once, nor the extent to which this mixed data could provide useful insights. As with any observational experiment in bioinformatics, our findings can only be as complete as the databases used for making comparisons.
One advantage of MinION sequencing is the possibility of measuring the quantity of each species identified, rather than simply the presence or absence. This works by measuring the number of DNA reads per species and can add an extra level of useful detail for analysis. Unfortunately, this was not feasible in our experiment, as by barcoding several samples into a single sequencing run we reduced the reliability for quantification.
Barcoding samples while sequencing metagenomes is something that we are not aware of others attempting. While we can say that this does work, each additional sample you add reduces the ability to identify species. To optimise this approach, it would be necessary to trial sequencing samples with different amounts of additional samples to identify the point at which the number of species identified drops below an acceptable level.
Something we did notice was the possibility of using barcoding to detect sample cross-contamination. When analysing our data, it was possible to detect a handful of DNA reads (fewer than 10) from a soil sample that we had not intentionally put onto the flow cell. Although this level of contamination is not a significant worry, the fact that it was detectable was intriguing. In labs with contamination issues, barcoding could become a methodology for tracing the source.
The short DNA read lengths found in our samples is another aspect that would need optimising. The method to extract DNA found in soil is relatively abrasive and so may inherently damage DNA. Could the number of identified species be improved by using any of the available DNA repair protocols?
Using MinION and Metrichor
One of the aims of our project was to gauge the usability of MinION by anyone, anywhere. While it was possible to use MinION, it does have a way to go before this ambition is realised. Oxford Nanopore are most likely aware of this, particularly with announcements of VolTRAX, a device that automates all sample preparation following DNA extraction, and SmidgION (yes it’s really called that) which miniaturises MinION further and will use a smartphone as its computing power.
CB: Mobile phone SmidgION in 2018; proof of principle that you can run MinION from a phone now (skunk works) #nanoporeconf
— Ewan Birney (@ewanbirney) May 4, 2017
As an example of the limitations, the need for a qubit for precise measurement of DNA concentration at several points in the process meant that we needed additional equipment which was comparatively expensive. While not a problem in a professional lab, it did add a hurdle for us and would likely add one for anyone else trying to do this without their own lab.
In terms of analysis tools, WIMP is very impressive, but it’s not yet at a stage where it can be easily used for this kind of analysis. For example, it’s not currently possible to compare multiple samples at the same time within the app. For this, data must be downloaded into an alternative analysis tool. Unfortunately, when data is downloaded, it is not easy to separate reads based upon taxonomic level (Species, Class, Order, Phylum, etc.) The display of species identified is attractive, but becomes very difficult to read when there are multiple species as names can often overlap.
We were trying to understand the role that each species identified plays in the soil environment. WIMP enables species identification, but offers little in helping to describe possibly relevant activities of each species, such as growing conditions or metabolism of specific compounds. This functionality may be beyond the remit of WIMP, but would be an incredibly helpful addition.
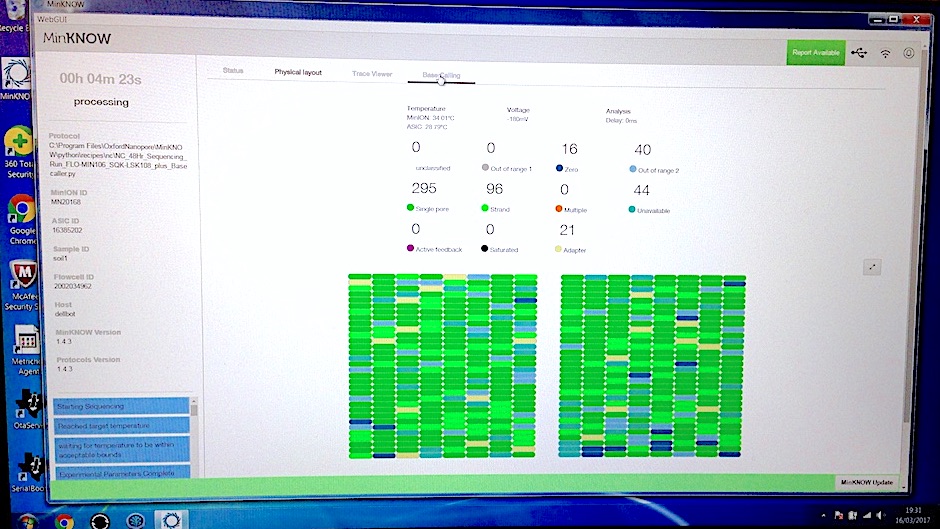
The user interface for MinION — MinKNOW.
This point extends to genetic databases of microorganisms. In general, they don’t appear to be set up to ask questions about a microorganisms’ utility or impact within a particular environment. Although data about growing conditions and roles in various nutrient cycles can be found, this generally is on a case by case basis. For the specific domain of soil health, an easily accessible list of bacteria with a role in the nitrogen cycle would be an excellent resource (if this database does exist, please let us know!). This would increase the power of sequencing analysis by allowing these bacteria to be highlighted when identified.
Overall, the cost of genetics sequencing is very high in comparison to the cost of chemical analysis. Of course, sequencing is a new technology and its price has dropped enormously in recent years. Still, for our use case of measuring soil health, it will be some time before this technology becomes economical. For this to happen, the value in the data would need to be much easier to access, as well as the overall cost of reagents, equipment and analysis time will need to be reduced.
Moreover, if sequencing equipment (such as MinION) and bioinformatics software (such as Metrichor or WIMP) are to bring bioinformatics capabilities to wider groups of non-expert users together with all the value derived from genomic insights, they need to become more user-friendly. If you are familiar with our earlier blog posts (about our work with Genomics PLC, EBI Summer Bioinformatics School, or launching Sequence Bundles), you will know that this challenge is particularly close to our own interests.
Some of these criticisms may seem quite harsh, however it is precisely because of how far Oxford Nanopore has come with the MinION and Metrichor, that we are attempting to ask serious questions about novel applications for genetic sequencing. At the beginning of the project we wondered if MinION could enable people to monitor the health of their own soil. While this is feasible, the cost, preparation and analysis demands are simply too great for this to be efficient at the moment. However, it would be plausible for service laboratories using nanopore technology to perform systematic testing on soil samples in the future, in the same way that chemical analysis is being done now.
Conclusions
Our experience using MinION has been a fascinating and tantalising journey. Along the way we have collaborated and spoken with many generous and helpful people who have shared their time and expertise with us. In particular James Chong and Anna Alessi at York University, Lauren Cowley from Harvard (previously Public Health England), Mike Cox at the National Heart and Lung Institute, Joe Parker at the Jodrell Laboratory, the members of the BioHackspace in London, Ulrike Kauscher from Imperial College London and the staff of the London Genome Centre at Queen Mary University have helped us enormously to learn and experiment.
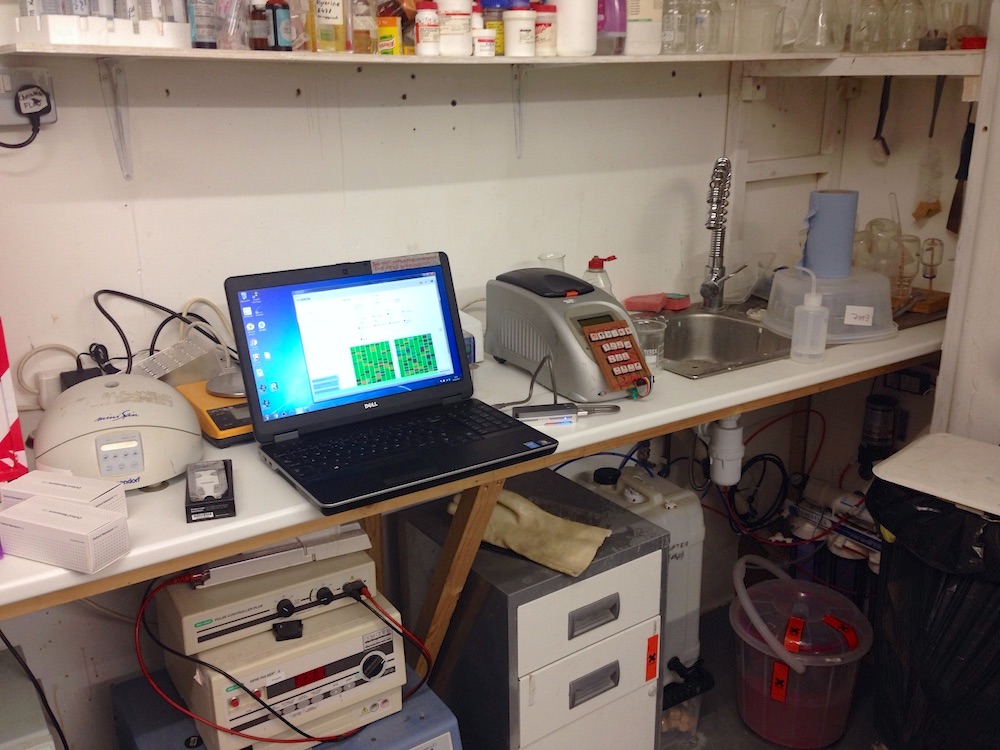
Our MinION running at the BioHackspace Lab in London.
As a proof of principle, there is too little data to know for sure what is the most appropriate use of sequencing in relation to soil health. However, the correlations we have observed suggest that it is likely that sequencing can be a useful data type for exploring soil. The data we collected tentatively points towards the identification of species with specific known roles in soil nutrient cycling or plant pathogenicity, as useful information for people looking to better understand their soil’s health. Diversity as an overall indicator of health could also be of use, though it seems to be a more general measure.
A significant question for next steps would be to better understand how this information can be actionable. There are a few companies such as Mammoth Microbes, that are developing bio-inoculants to improve soil health by introducing specific bacteria to soil. While this concept is in its early days, paired with sequencing data, this option could become more precise and potentially more effective.
In order for this sequence data to be robust, a significant number of experiments would have to be carried out to understand how best to optimise soil sampling methods. Making sure that a soil sample is representative of a larger area is a significant challenge that this proof of principle does not address.
Overall, we think it’s truly remarkable that it is now possible for a company that does not have a laboratory to design and run genetic sequencing experiments. This experience has inspired us to continue our explorations in genetics and genomics, to increase our efforts to design useful tools to understand genetic data, and to create products that build on this understanding.